Note: Important information in this article is masked with ***.
Recently, just before the National Day holiday, we encountered a very troublesome problem that kept us working overtime until three in the morning.
Background:
The client provided some SDK libraries written in C, packed into .so files, which we called using C#. One of the functions is a callback function, and its parameter is a structure consisting of functions. We assign a C# function to a delegate and store it in this delegate.
C# calls the C function, and then when the C function reaches certain steps, it calls the C# function. This worked fine on ARM64 machines, such as Raspberry Pi and Huawei's Kunpeng servers. However, when we suddenly switched to deploying the project on x64 machines without testing and packaged it directly (using Docker), problems arose.
The reasons for not testing were twofold:
First, it is well known that .NET Core is cross-platform; since we had already tested on ARM64, it should be fine.
Second, the project is a Huawei edge IoT project that must go through Huawei Cloud to register the edge device and then use cloud services to deploy the application (in Docker) to the machine to run successfully (many system environment variables and IoT connection credentials for Huawei are automatically created). Directly starting it on the machine would not complete the entire process properly.
Third, the issue came up too suddenly, leaving no time for testing.
In fact, this is how fortunate it is—when things go wrong, we end up working overtime and receiving our karmic rewards~
Everyone remember, before deploying and demonstrating a project, always test, test, and test again.
Problem Encountered
After the application is deployed to the devices from the cloud, it would crash after running for a while. Then we modified the Docker container's startup script and manually executed the command to start the program after entering the container.
In the end, we found:
dotnet xxx.dll

...
...
Segmentation fault (core dumped)
The occurrence of the Segmentation fault (core dumped) issue may indicate pointer address overflow, accessing non-existent memory, protected memory, etc. For reference, see: http://ilinuxkernel.com/?p=1388
https://www.geeksforgeeks.org/core-dump-segmentation-fault-c-cpp/
Since this issue is kernel-level, detailed log information can be found in the system logs.
Checking Kernel Logs
Logs can be checked both in the container and on the physical machine; however, the information within the container is too limited, so we mainly look for information logs from the physical machine.
On the physical machine:
# Kernel logs
cat /var/log/kern.log

# System logs
cat /var/log/syslog
At first, a senior colleague suggested that the memory might have been reclaimed, and that functions had not used static to prevent GC reclamation; therefore, before the C callback, that section of memory in C# might have already been reclaimed.
However, I modified the code, changed everything to static, and printed the addresses, even prohibiting GC reclamation, yet the result remained the same.
Checking the memory address of a reference type:
        public string getMemory(object o)
        {
            GCHandle h = GCHandle.Alloc(o, GCHandleType.WeakTrackResurrection);

            IntPtr addr = GCHandle.ToIntPtr(h);

            return "0x" + addr.ToString("X");
        }
Attempting to prohibit GC reclamation:
GC.TryStartNoGCRegion(1);
...
...
GC.EndNoGCRegion();
Tool Debugging
After several prompts, I learned that I could use GDB to debug the .so file, so I quickly googled for information and, after some time, learned how to use these tools to query exception stack information.
GDB
The GNU Debugger, also known as gdb, is the most popular debugger for debugging C and C++ programs on UNIX systems.
If a core dump happened, then what statement or expression did the program crash on?
If an error occurs while executing a function, what line of the program contains the call to that function, and what are the parameters?
What are the values of program variables at a particular point during execution of the program?
What is the result of a particular expression in a program?
You can try using an online C/C++ compiler with GDB to experience it: https://www.onlinegdb.com/
Back to the point, to debug .NET programs in either a physical machine or Docker, you need to install GDB, which can be done using:
apt install gdb
or
yum install gdb
strace
Additionally, the strace tool is also very useful as it can show stack information. You can install it using:
apt install strace
binutils
The objcopy and strip tools can be used to process and tidy up the symbol information of .so libraries.
To install objcopy and strip:
apt install binutils
The binutils package includes objcopy and strip.
Debugging and Core Dumps
Before using GDB for debugging, let's understand core dump dump files.
This is equivalent to the snapshot file generated by the .NET Core tool dotnet-dump.
To generate a dump file, the operating system needs to enable the feature.
On the physical machine, execute:
ulimit -c unlimited
In the Docker environment, execute:
ulimit -c unlimited
To customize the location of the dump file, execute:
echo "/tmp/core-%e-%p-%t" > /proc/sys/kernel/core_pattern
Then, enter the container, start the .NET program using the dotnet command, and wait for the program to crash:
dotnet xxx.dll

...
...
Segmentation fault (core dumped)
Check the tmp directory; a file in the format corefile-dotnet-{processid}-{time} should be generated.
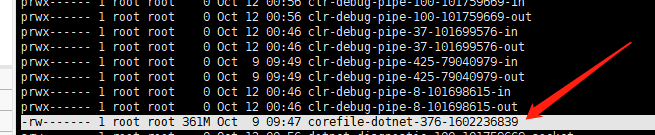
Use the following command to enter the core dump file.
gdb -c corefile-dotnet-376-1602236839
Execute the bt command.
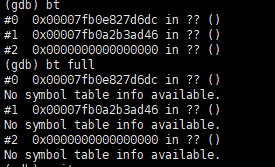
We found some information, but there was too little useful information, and all the names were ??, making it impossible to pinpoint the exact location of the problem. What to do?
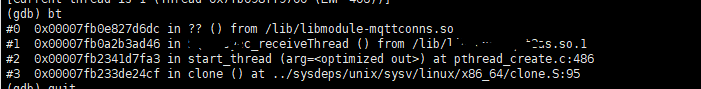
We can include the .so file when checking.
gdb -c corefile-dotnet-376-1602236839 /***/lib***.so
You can also include multiple .so files together:
gdb -c corefile-dotnet-376-1602236839 /***/libAAA.so /***/libBBB.so
Using strace
The strace command in Linux can trace system calls and signals.
If the command is not present on the system, you can install it directly using:
apt install strace
or
yum install strace
Then, use the strace command to start the .NET program:
strace dotnet /***/***.dll
After starting, you can see the program's stack information and the function definitions when calling functions.
GDB Debugging to Start the .NET Program
To start the .NET Core runtime, execute the following command:
gdb dotnet
In gdb, execute start to launch the program. However, just starting the .NET Core runtime is not useful; you also need to launch the .NET program.
Therefore, the path of the .NET program must be passed as an argument to dotnet.
start /***/***.dll
The terminal displays:
(gdb) start /***/***.dll
Function "main" not defined.
Make breakpoint pending on future shared library load? (y or [n]) y
Temporary breakpoint 1 (main) pending.
This seems a bit complicated; we can define the parameters at startup:
gdb --args dotnet /***/***.dll
Also, run executes immediately, while start prompts for information and allows for breakpoint debugging.
Once the program crashes, use the bt command to check the stack information for exceptions.
The generated results look like this:
Stripping Debug Information from .so Files
In Linux, the strip command specifically removes certain symbol information and debug information from specific files. You can use the following command sequence to extract debugging information from the .so file.
objcopy --only-keep-debug lib***.so lib***.so.debug
strip lib***.so -o lib***.so.release
objcopy --add-gnu-debuglink=lib***.so.debug lib***.so.release
cp lib***.so.release lib***.so
Checking if the .so has Symbol Information
To debug a .NET Core program, a .pdb symbol file is required; to debug a .so file, symbol information must also be available.
You can determine whether a .so file can be debugged using the following command:
gdb xxx.so
If debugging information cannot be read, it will show:
Reading symbols from xxx.so...(no debugging symbols found)...done.
If it can read the debugging information, it will display:
Reading symbols from xxx.so...done.
You can also use the file command for additional information:
xxx.so: ELF 64-bit LSB shared object, x86-64, version 1 (SYSV), dynamically linked, BuildID[sha1]=8007fbdc7941545fe4e0c61fa8472df1475887c3c1, stripped
If the last part states stripped, it indicates that the symbol table information and debug information has been removed or is not included, thus not allowing gdb debugging.
To initiate debugging, the aim is to start the .NET Core runtime and then the .NET program. Linux and GDB cannot directly start a .NET program.
In this case, the CLI command to use is necessary, running the dotnet command to start a .NET program.
gdb --args dotnet /opt/ganwei/IoTCenter/bin/GWHost1.dll
Or
gdb dotnet
...
# In GDB after entering
set args /opt/ganwei/IoTCenter/bin/GWHost1.dll
Viewing Call Stack Information
The following two gdb commands can be used to view the current call stack information. If the program crashes during a function call, executing these commands will show the function call stack when the program terminated.
bt
bt full
backtrace
backtrace full
Here, bt is an abbreviation for backtrace, and the two are completely identical.
To check the current code's execution location, if the program has already terminated, it will output the last executed function's stack before termination.
where
Using bt, you can see the function's call relationships, which function called which, and in which function the exception occurred.
#0  0x00007fb2cd5f66dc in ?? () from /lib/lib***.so
#1  0x00007fb2ccf29d46 in ***_receiveThread () from /lib/lib***BBB.so.1
#2  0x00007fb456ef1fa3 in start_thread (arg=<optimized out>) at pthread_create.c:486
#3  0x00007fb456afc4cf in clone () at ../sysdeps/unix/sysv/linux/x86_64/clone.S:95
The bt full command can provide more detailed information.
[Thread 0x7fb2b53b7700 (LWP 131) exited]

Thread 31 "dotnet" received signal SIGSEGV, Segmentation fault.
[Switching to Thread 0x7fb2affff700 (LWP 133)]
0x00007fb2cd5f66dc in ?? () from /lib/lib***.so
(gdb) bt full
#0  0x00007fb2cd5f66dc in ?? () from /lib/lib***.so
No symbol table info available.
#1  0x00007fb2ccf29d46 in ***_receiveThread () from /lib/lib***BBB.so.1
No symbol table info available.
#2  0x00007fb456ef1fa3 in start_thread (arg=<optimized out>) at pthread_create.c:486
        ret = <optimized out>
        pd = <optimized out>
        now = <optimized out>
        unwind_buf = {cancel_jmp_buf = {{jmp_buf = {140405433693952, 264024675094789190, 140405521476830, 140405521476831, 140405433693952, 140407320872320,
                -229860650334651322, -233434198962832314}, mask_was_saved = 0}}, priv = {pad = {0x0, 0x0, 0x0, 0x0}, data = {prev = 0x0, cleanup = 0x0,
              canceltype = 0}}}
        not_first_call = <optimized out>
#3  0x00007fb456afc4cf in clone () at ../sysdeps/unix/sysv/linux/x86_64/clone.S:95
No locals.
We can see that the actual problem occurred in another .so library, so we need to make debugging information for this .so.
lib***BBB.so.1
Previously identified that the issue might be related to in ?? () from /lib/lib***.so, but here the information is ??, is there a way to find more information?
Let's first clear the contents of the /tmp directory.
Then execute strace dotnet /xxx/dll or dotnet xxx.dll once again, waiting for the /tmp directory to generate a core dump dump file.
It turns out the result is still the same~~~there's really no way around it, so let's call it a day~
Viewing Call Stack Information for All Threads
The thread command in gdb can be used to view the call stack information for all threads.
thread apply all bt
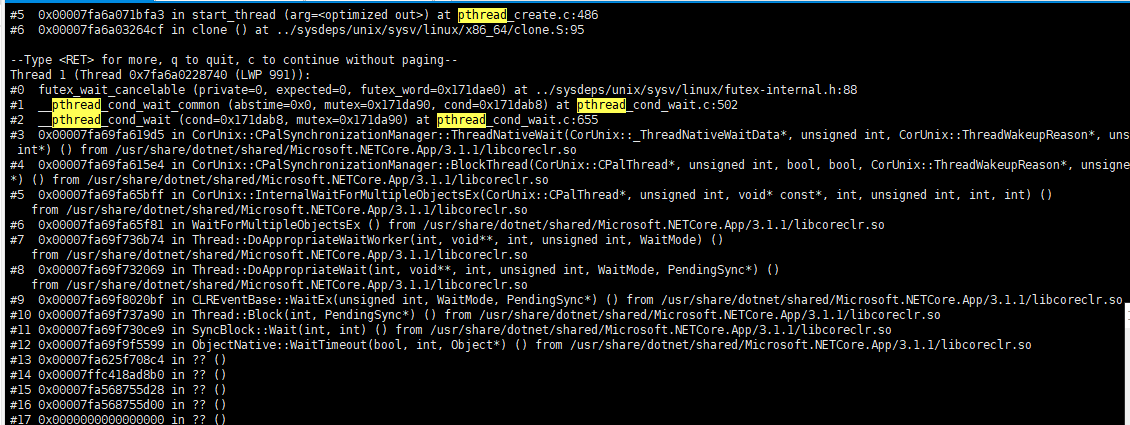
Here, everyone should pay attention to the pthread; before the program terminates, the keyword pthread appears.
.
Then I looked up some information: https://man7.org/linux/man-pages/man7/pthreads.7.html
From the information gathered, it is known that Linux's pthreads are generally kernel threads: https://www.zhihu.com/question/35128513
Let's pause for a moment and speculate whether the issue could be related to multithreading. Let's check out the relevant logs:
#1  0x00007fb2ccf29d46 in MQTTAsync_receiveThread () from /lib/lib***BBB.so.1
#2  0x00007fb456ef1fa3 in start_thread (arg=<optimized out>) at pthread_create.c:486
Thread 1 (Thread 0x7fa6a0228740 (LWP 991)):
#0  futex_wait_cancelable (private=0, expected=0, futex_word=0x171dae0) at ../sysdeps/unix/sysv/linux/futex-internal.h:88
#1  __pthread_cond_wait_common (abstime=0x0, mutex=0x171da90, cond=0x171dab8) at pthread_cond_wait.c:502
#2  __pthread_cond_wait (cond=0x171dab8, mutex=0x171da90) at pthread_cond_wait.c:655
#3  0x00007fa69fa619d5 in CorUnix::CPalSynchronizationManager::ThreadNativeWait(CorUnix::_ThreadNativeWaitData*, unsigned int, CorUnix::ThreadWakeupReason*, unsigned int*) () from /usr/share/dotnet/shared/Microsoft.NETCore.App/3.1.1/libcoreclr.so
#4  0x00007fa69fa615e4 in CorUnix::CPalSynchronizationManager::BlockThread(CorUnix::CPalThread*, unsigned int, bool, bool, CorUnix::ThreadWakeupReason*, unsigned int*) () from /usr/share/dotnet/shared/Microsoft.NETCore.App/3.1.1/libcoreclr.so
#5  0x00007fa69fa65bff in CorUnix::InternalWaitForMultipleObjectsEx(CorUnix::CPalThread*, unsigned int, void* const*, int, unsigned int, int, int) ()
Could it be that the pthreads related to CoreCLR and the .so library are causing the issue? However, I'm not an expert in C and don't have much knowledge about Linux C, so I need to catch up on a lot of knowledge.
Let’s make a bold guess: could it be a similar error to the one described here: https://stackoverflow.com/questions/19711861/segmentation-fault-when-using-threads-c?
Also like this one: https://stackoverflow.com/questions/8018272/pthread-segmentation-fault

Could it be related to the machine hardware?
Why is this happening?
Can more information be found?
I'm not familiar with C. What should I do?
Solved the Issue
Could it be that using GDB is sufficient to solve the problem? No.
Seeing that the problem remained unsolved, I asked the author of Jexus, the great master Yunei Liuyun. I showed him the detailed error information, and he suggested trying to use IntPtr.
So I changed the function parameters from
ST_MODULE_CBS* module_cbs, ST_DEVICE_CBS* device_cbs
to
IntPtr module_cbs, IntPtr device_cbs
The rest is about converting the structure to IntPtr. For IntPtr documentation, please refer to https://docs.microsoft.com/zh-cn/dotnet/api/system.intptr?view=netcore-3.1
Then I used the structure conversion function:
        private static IntPtr StructToPtr(object obj)
        {
            var ptr = Marshal.AllocHGlobal(Marshal.SizeOf(obj));
            Marshal.StructureToPtr(obj, ptr, false);
            return ptr;
        }
I changed it to unsafely call the C function:
            unsafe
            {
                IntPtr a = StructToPtr(cbs);
                IntPtr b = StructToPtr(device_cbs);
                EdgeSDK.edge_set_callbacks(a, b);
            }
After testing it again, it finally worked normally!!!
Practice has proved that to call C code from C#, or to use callbacks, it’s essential to have a good grasp of unsafe code and ref usage in C#~~~
The fact is that when faced with unsolvable problems, it's better to tightly hold onto the great master’s thigh~~~
Let me promote Jexus:
Jexus is a powerful, robust, free, and easy-to-use domestic WEB server system that can replace Nginx. Jexus supports Arm32/64, X86/X64, MIPS, Loongson and other types of CPUs, and is a high-performance WEB server and load balancing gateway server on the Linux platform, featuring support for ASP.NET, ASP.NET CORE, and PHP, while also possessing important functions such as reverse proxy and intrusion detection.
It can be said that Jexus is the best host server for .NET and .NET CORE cross-platform. If we consider it as the IIS of the Linux platform, that would not be an exaggeration, because Jexus is not only very fast, but also has a high level of security that IIS and other web servers lack. Meanwhile, Jexus Web Server is completely developed by Chinese developers, achieving true "safety, reliability, and controllability," possessing crucial qualities needed for the information technology construction of our party and government organs and important enterprises and institutions.

文章评论