- .NET Core Logging and Distributed Tracing
.NET Core Logging and Distributed Tracing
Logs recorded by programs generally serve two purposes: troubleshooting and explicitly indicating program runtime status. When a program encounters an issue, logs can help identify the problem, providing a basis for fault detection. Often times, logging is perceived to be simply done through try-catch{} statements that directly output to .txt files, but such logs often fail to assist in locating issues and may be filled with excessive garbage content; thus, logs require manual line-by-line scanning or Ctrl+F searches to review efficiently. Logs output only to text files, with no good management structure.
Next, we will step-by-step learn about writing logs, as well as related knowledge for OpenTracing API and Jaeger distributed tracing.
.NET Core Logging
Console Output
The simplest form of logging is via console output, utilizing the Console.WriteLine() function to directly output information.
Below is a simple information output example, where calling the SayHello function will print a message.
    public class Hello
    {
        public void SayHello(string content)
        {
            var str = $"Hello,{content}";
            Console.WriteLine(str);
        }
    }

    class Program
    {
        static void Main(string[] args)
        {
            Hello hello = new Hello();
            hello.SayHello("any one");
            Console.Read();
        }
    }
Non-intrusive Logging
From the console, we can see that to log, we must write input log code within the function. The pros and cons of this approach need not be elaborated; through an AOP framework, we can achieve aspect-oriented programming to log uniformly.
Here we can use the author's open-source CZGL.AOP framework, which can be found in NuGet.

By writing unified cutting edge code, this code will execute when the function is called.
Before will be effective before the proxy method is executed or when the proxy property is called, and you can retrieve and modify passed parameters through AspectContext.
After will be effective after the method execution or property call, and you can retrieve and modify the return value via context.
    public class LogAttribute : ActionAttribute
    {
        public override void Before(AspectContext context)
        {
            Console.WriteLine($"{context.MethodInfo.Name} function is executed before");
        }

        public override object After(AspectContext context)
        {
            Console.WriteLine($"{context.MethodInfo.Name} function is executed after");
            return null;
        }
    }
Transform the Hello class as follows:
    [Interceptor]
    public class Hello
    {
        [Log]
        public virtual void SayHello(string content)
        {
            var str = $"Hello,{content}";
            Console.WriteLine(str);
        }
    }
Then create the proxy type:
        static void Main(string[] args)
        {
            Hello hello = AopInterceptor.CreateProxyOfClass<Hello>();
            hello.SayHello("any one");
            Console.Read();
        }
Starting the program will output:
SayHello function is executed before
Hello,any one
SayHello function is executed after
You need not worry about the AOP framework causing performance issues, as the CZGL.AOP framework uses EMIT for writing and comes with caching; once a type has been proxied, it does not need to be regenerated repeatedly.
CZGL.AOP can be combined with the built-in dependency injection framework of .NET Core and Autofac to automatically proxy services within the CI container, eliminating the need for manual calls to AopInterceptor.CreateProxyOfClass.
The CZGL.AOP code is open source, and you can refer to the author's other blog post:
https://www.cnblogs.com/whuanle/p/13160139.html
Microsoft.Extensions.Logging
Some companies lack technical management standards, resulting in different developers using various logging frameworks; a product may incorporate .txt, NLog, Serilog, etc., without a unified encapsulation.
The logging components in .NET Core are many, but popular logging frameworks generally implement Microsoft.Extensions.Logging.Abstractions, hence we can study Microsoft.Extensions.Logging. Microsoft.Extensions.Logging.Abstractions is an official abstraction of logging components. If a logging component does not support Microsoft.Extensions.Logging.Abstractions, integrating that component into projects can lead to complications, making future modularization and coupling reduction difficult.
The Microsoft.Extensions.Logging package contains Logging APIs that cannot operate independently; instead, they are used in conjunction with one or more logging providers that store or display logs to specific outputs such as Console, Debug, and TraceListeners.
The following image shows the hierarchy of Logging API in .NET Core:
Image source: https://www.tutorialsteacher.com/
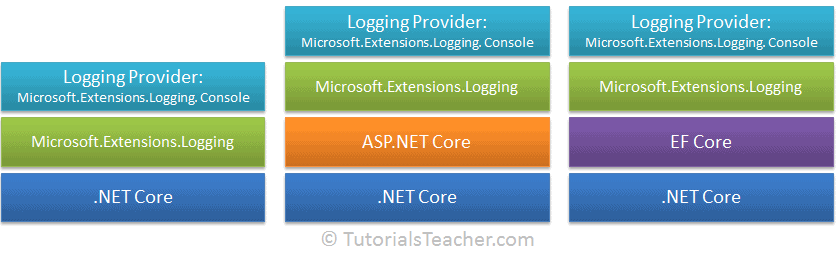
To be honest, I initially found Microsoft.Extensions.Logging quite confusing, with a seemingly complex configuration. Therefore, having a clear structured diagram is important, as it aids understanding of the Logging API within.
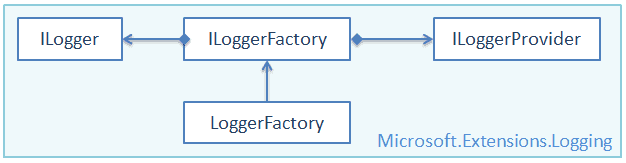
ILoggerFactory
Many standard interfaces in .NET Core embody the idea of the factory pattern, with ILoggerFactory being the factory pattern interface and LoggerFactory being its implementation.
Its definition is as follows:
public interface ILoggerFactory : IDisposable
{
    ILogger CreateLogger(string categoryName);
    void AddProvider(ILoggerProvider provider);
}
The purpose of the ILoggerFactory factory interface is to create an instance of type ILogger, specifically through the CreateLogger interface.
ILoggerProvider
By implementing the ILoggerProvider interface, one can create their own logging provider that represents a type capable of creating ILogger instances.
Its definition is as follows:
public interface ILoggerProvider : IDisposable
{
    ILogger CreateLogger(string categoryName);
}
ILogger
The ILogger interface provides methods for logging to underlying storage, defined as follows:
public interface ILogger
{
    void Log<TState>(LogLevel logLevel,
                     EventId eventId,
                     TState state,
                     Exception exception,
                     Func<TState, Exception, string> formatter);

    bool IsEnabled(LogLevel logLevel);
    IDisposable BeginScope<TState>(TState state);
}
Logging Providers
Logging providers refer to logging implementations.
Logging Providers display or store logs to specific mediums, such as console, debugging events, event logs, Trace listeners, etc.
Microsoft.Extensions.Logging offers the following types of logging providers, which can be obtained via NuGet:
- Microsoft.Extensions.Logging.Console
- Microsoft.Extensions.Logging.AzureAppServices
- Microsoft.Extensions.Logging.Debug
- Microsoft.Extensions.Logging.EventLog
- Microsoft.Extensions.Logging.EventSource
- Microsoft.Extensions.Logging.TraceSource
Meanwhile, Serilog provides File, Console, Elasticsearch, Debug, MSSqlServer, Email, etc.
There are numerous logging providers, and we need not delve into them; if a logging component does not provide compatibility with Microsoft.Extensions.Logging, it should not be incorporated.
In reality, many programs directly utilize File.Write("Log.txt"). How good can such product quality be?
Usage
Previously, we introduced the composition of Microsoft.Extensions.Logging; here we will learn how to use a Logging Provider to input logs.
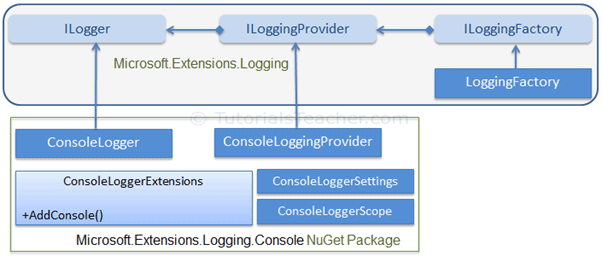
It is crucial to note that it merely provides a Logging API; thus, to output logs, we must select a suitable Logging Provider program. Here, we choose
Microsoft.Extensions.Logging.Console, which should be referenced from NuGet.
Below is a structural diagram illustrating the combination of Logging Provider and ConsoleLogger:
From a conventional approach, I realized that configuring it was challenging...
            ConsoleLoggerProvider consoleLoggerProvider = new ConsoleLoggerProvider(
                new OptionsMonitor<ConsoleLoggerOptions>(
                    new OptionsFactory<ConsoleLoggerOptions>(
                        new IEnumerable<IConfigureOptions<TOptions>>(... ... ...))));
Thus, we can only use the following code to quickly create a factory:
            using ILoggerFactory loggerFactory =
                LoggerFactory.Create(builder =>
                    builder.AddSimpleConsole(options =>
                    {
                        options.IncludeScopes = true;
                        options.SingleLine = true;
                        options.TimestampFormat = "hh:mm:ss ";
                    }));
Or:
ILoggerFactory loggerFactory = LoggerFactory.Create(builder => builder.AddConsole());
Of course, other logging providers can be added to the factory; for example:
            using ILoggerFactory loggerFactory =
                LoggerFactory.Create(builder =>
                    builder.AddSimpleConsole(...)
                    .AddFile(...)
                    .Add()...
                    );
Then fetch an ILogger instance:
ILogger logger = loggerFactory.CreateLogger<Program>();
Log the information:
logger.LogInformation("Logging information.");
Log Levels
In the Logging API, seven log levels are defined as follows:
public enum LogLevel
{
  Debug = 1,
  Verbose = 2,
  Information = 3,
  Warning = 4,
  Error = 5,
  Critical = 6,
  None = int.MaxValue
}
We can output several levels of logs using functions within ILogger:
            logger.LogInformation("Logging information.");
            logger.LogCritical("Logging critical information.");
            logger.LogDebug("Logging debug information.");
            logger.LogError("Logging error information.");
            logger.LogTrace("Logging trace");
            logger.LogWarning("Logging warning.");
Regarding Microsoft.Extensions.Logging, no further details will be provided here; readers can refer to the following links for more related knowledge:
https://docs.microsoft.com/zh-cn/aspnet/core/fundamentals/logging/?view=aspnetcore-5.0#log-exceptions
https://www.tutorialsteacher.com/core/fundamentals-of-logging-in-dotnet-core
https://docs.microsoft.com/en-us/archive/msdn-magazine/2016/april/essential-net-logging-with-net-core
Trace and Debug
The namespaces for the Debug and Trace classes are System.Diagnostics. Debug and Trace provide a set of methods and properties that facilitate code debugging.
Readers can refer to the author's other article:
https://www.cnblogs.com/whuanle/p/14141213.html#3
Output to the console:
Trace.Listeners.Add(new TextWriterTraceListener(Console.Out));
Debug.WriteLine("Information");
Tracing
Tracing helps developers quickly identify performance bottlenecks in distributed application architectures, improving diagnosis efficiency in the era of microservices.
OpenTracing
The aforementioned Trace and Debug are APIs provided in .NET Core for developers to diagnose programs and output information, while tracing refers to the tracing function in the OpenTracing API.
Traditional logging has significant drawbacks, as it involves recording a log for each method. It's challenging to connect multiple methods called during a workflow. When an exception occurs in a method, it is difficult to know which task process failed, and we can only see which method encountered an error and its caller.
In OpenTracing, a Trace is a directed acyclic graph having Spans. A Span represents a logical representation of completing some work within an application, and each Span has the following properties:
- Operation Name
- Start Time
- End Time
To clarify what Trace and Span are, and what OpenTracing encompasses, please introduce OpenTracing from NuGet.
.
Implementing the Hello Class
public class Hello
{
    private readonly ITracer _tracer;
    private readonly ILogger<Hello> _logger;

    public Hello(ITracer tracer, ILoggerFactory loggerFactory)
    {
        _tracer = tracer;
        _logger = loggerFactory.CreateLogger<Hello>();
    }

    public void SayHello(string content)
    {
        // Create and start a Span
        var spanBuilder = _tracer.BuildSpan("say-hello");
        // -------------------------------
        var span = spanBuilder.Start(); // |
        var str = $"Hello,{content}";   // |
        _logger.LogInformation(str);    // |
        span.Finish();                  // |
        // ---------------------------------
    }
}
Starting the Program and Initiating Trace
static void Main(string[] args)
{
    using ILoggerFactory loggerFactory = LoggerFactory.Create(builder => builder.AddConsole());

    Hello hello = new Hello(GlobalTracer.Instance, loggerFactory);
    hello.SayHello("This trace");
    Console.Read();
}
In the process above, we use the OpenTracing API. Below are some explanations of the elements in the code:
- ITracer is a tracing instance, and BuildSpan() can create a Span;
- Each ISpan has an operation name, for example,
say-hello; - Use
Start()to begin a Span; useFinish()to end a Span; - The tracer automatically records timestamps;
Of course, when we run the above program, no other information or UI interface appears. This is because GlobalTracer.Instance returns a no-op tracer. When we define a Tracer, we can observe the tracing process.
Introducing Jaeger in NuGet
In the Program, add a static function that returns a custom Tracer:
private static Tracer InitTracer(string serviceName, ILoggerFactory loggerFactory)
{
    var samplerConfiguration = new Configuration.SamplerConfiguration(loggerFactory)
        .WithType(ConstSampler.Type)
        .WithParam(1);

    var reporterConfiguration = new Configuration.ReporterConfiguration(loggerFactory)
        .WithLogSpans(true);

    return (Tracer)new Configuration(serviceName, loggerFactory)
        .WithSampler(samplerConfiguration)
        .WithReporter(reporterConfiguration)
        .GetTracer();
}
Modify the contents of the Main function as follows:
static void Main(string[] args)
{
    using ILoggerFactory loggerFactory = LoggerFactory.Create(builder => builder.AddConsole());
    var tracer = InitTracer("hello-world", loggerFactory);
    Hello hello = new Hello(tracer, loggerFactory);
    hello.SayHello("This trace");
    Console.Read();
}
Context and Tracing Features
However, directly outputting string logs is unfriendly, and we need structured logging.
Of course, ISpan provides methods for structured logging, and we can write a method to format the logs.
Tracing Individual Functions
Add the following code to the Hello class:
private string FormatString(ISpan rootSpan, string helloTo)
{
    var span = _tracer.BuildSpan("format-string").Start();
    try
    {
        var helloString = $"Hello, {helloTo}!";
        span.Log(new Dictionary<string, object>
        {
            [LogFields.Event] = "string.Format",
            ["value"] = helloString
        });
        return helloString;
    }
    finally
    {
        span.Finish();
    }
}
Additionally, we can encapsulate a function to output string information:
private void PrintHello(ISpan rootSpan, string helloString)
{
    var span = _tracer.BuildSpan("print-hello").Start();
    try
    {
        _logger.LogInformation(helloString);
        span.Log("WriteLine");
    }
    finally
    {
        span.Finish();
    }
}
Change the SayHello method to:
public void SayHello(string content)
{
    var spanBuilder = _tracer.BuildSpan("say-hello");
    var span = spanBuilder.Start();
    var str = FormatString(span, content);
    PrintHello(span, str);
    span.Finish();
}
The reason for modifying the above code is to avoid mixing too much code in one method. Instead, we can try to reuse some code and encapsulate a unified code.
However, originally we just needed to call the SayHello method once, but now one method continues to call the other two methods. Originally it was one Span, but it has become three.
info: Jaeger.Configuration[0]
info: Jaeger.Reporters.LoggingReporter[0]
      Span reported: 77f1a24676a3ffe1:77f1a24676a3ffe1:0000000000000000:1 - format-string
info: ConsoleApp1.Hello[0]
      Hello, This trace!
info: Jaeger.Reporters.LoggingReporter[0]
      Span reported: cebd31b028a27882:cebd31b028a27882:0000000000000000:1 - print-hello
info: Jaeger.Reporters.LoggingReporter[0]
      Span reported: 44d89e11c8ef51d6:44d89e11c8ef51d6:0000000000000000:1 - say-hello
Note: 0000000000000000 indicates that a Span has already ended.
Advantages: From the code perspective, we can clearly see the call chain for SayHello -> FormatString and SayHello -> PrintHello.
Disadvantages: From the output perspective, the Span reported is different. We cannot identify the causal relationship between the three functions from the output.
We cannot always keep an eye on the code. Operation and implementation personnel also cannot compare and find code logic with the code.
Merging Multiple Spans into One Trace
ITracer is responsible for creating tracing, so ITracer also provides an API to combine the causal relationship of multiple Spans.
The usage is as follows:
var rootSapn = _tracer.BuildSpan("say-hello");  // A
var span = _tracer.BuildSpan("format-string").AsChildOf(rootSpan).Start(); // B
// A -> B
We create a rootSpan, and then create a span that continues from rootSpan, forming rootSpan -> span.
info: Jaeger.Reporters.LoggingReporter[0]
      Span reported: 2f2c7b36f4f6b0b9:3dab62151c641380:2f2c7b36f4f6b0b9:1 - format-string
info: ConsoleApp1.Hello[0]
      Hello, This trace!
info: Jaeger.Reporters.LoggingReporter[0]
      Span reported: 2f2c7b36f4f6b0b9:9824227a41539786:2f2c7b36f4f6b0b9:1 - print-hello
info: Jaeger.Reporters.LoggingReporter[0]
      Span reported: 2f2c7b36f4f6b0b9:2f2c7b36f4f6b0b9:0000000000000000:1 - say-hello
Span reported: 2f2c7b36f4f6b0b9
The output order corresponds to the execution completion order, with say-hello being the last to complete.
Context Propagation During Tracing
From the code, it can be observed that the code is quite cumbersome because:
- The Span object must be passed as the first parameter to each function;
- Each function includes a lengthy
try-finally{}block to ensure the Span is completed.
To this end, the OpenTracing API provides a better method, allowing us to avoid passing Span as a parameter and call _tracer directly.
Modify FormatString and PrintHello code as follows:
private string FormatString(string helloTo)
{
    using var scope = _tracer.BuildSpan("format-string").StartActive(true);
    var helloString = $"Hello, {helloTo}!";
    scope.Span.Log(new Dictionary<string, object>
    {
        [LogFields.Event] = "string.Format",
        ["value"] = helloString
    });
    return helloString;
}

private void PrintHello(string helloString)
{
    using var scope = _tracer.BuildSpan("print-hello").StartActive(true);
    _logger.LogInformation(helloString);
    scope.Span.Log(new Dictionary<string, object>
    {
        [LogFields.Event] = "WriteLine"
    });
}
Modify the SayHello code as follows:
public void SayHello(string helloTo)
{
    using var scope = _tracer.BuildSpan("say-hello").StartActive(true);
    scope.Span.SetTag("hello-to", helloTo);
    var helloString = FormatString(helloTo);
    PrintHello(helloString);
}
With the above code, we have eliminated those annoying bits of code.
StartActive()replacesStart()and keeps the span in “active” status by storing it in thread-local storage;StartActive()returns anIScopeobject instead of anISpanobject. IScope is a container for the current active scope. By accessing the active spanscope.Span, once the scope is closed, the previous span will become the current one, reactivating the earlier active scope in the current thread;IScopeinherits fromIDisposable, allowing us to use theusingsyntax;StartActive(true)tells the Scope to finish when it is processed;StartActive()automatically creates a reference to the previous active scope as a ChildOf, so we don't have to explicitly use the builder methodAsChildOf();
When running this program, we will see that all three reported spans have the same trace ID.
Distributed Tracing
Tracking Across Different Processes
Microservices separate deployment of multiple programs, each providing different functionalities. Previously, we learned OpenTracing tracing. Next, we will split the code and the console program will no longer implement the FormatString function; instead, we will use a web program to implement the FormatString service.
Create an ASP.NET Core application, choosing the template with view model controllers.
Add a FormatController in the Controllers directory with the following code:
using Microsoft.AspNetCore.Mvc;

namespace WebApplication1.Controllers
{
    [Route("api/[controller]")]
    public class FormatController : Controller
    {
        [HttpGet]
        public string Get()
        {
            return "Hello!";
        }

        [HttpGet("{helloTo}", Name = "GetFormat")]
        public string Get(string helloTo)
        {
            var formattedHelloString = $"Hello, {helloTo}!";
            return formattedHelloString;
        }
    }
}
The web application will serve as one of the services in the microservice architecture, and this service has only one API, which is very simple and provides string formatting. You can also write other APIs to provide services.
Modify the Program's CreateHostBuilder to fix the port of this service:
public static IHostBuilder CreateHostBuilder(string[] args) =>
    Host.CreateDefaultBuilder(args)
        .ConfigureWebHostDefaults(webBuilder =>
        {
            webBuilder.UseUrls("http://*:8081");
            webBuilder.UseStartup<Startup>();
        });
Next, remove app.UseHttpsRedirection(); from the Startup class.
Modify the code in the console program to change the FormatString method as follows:
private string FormatString(string helloTo)
{
    using (var scope = _tracer.BuildSpan("format-string").StartActive(true))
    {
        using WebClient webClient = new WebClient();
        var url = $"http://localhost:8081/api/format/{helloTo}";
        var helloString = webClient.DownloadString(url);
        scope.Span.Log(new Dictionary<string, object>
        {
            [LogFields.Event] = "string.Format",
            ["value"] = helloString
        });
        return helloString;
    }
}
Start the web program and then launch the console program.
控制台程序输出:
info: Jaeger.Reporters.LoggingReporter[0]
      Span reported: c587bd888e8f1c19:2e3273568e6e373b:c587bd888e8f1c19:1 - format-string
info: ConsoleApp1.Hello[0]
      Hello, This trace!
info: Jaeger.Reporters.LoggingReporter[0]
      Span reported: c587bd888e8f1c19:f0416a0130d58924:c587bd888e8f1c19:1 - print-hello
info: Jaeger.Reporters.LoggingReporter[0]
      Span reported: c587bd888e8f1c19:c587bd888e8f1c19:0000000000000000:1 - say-hello
接着,我们可以将 Formating 改成:
        private string FormatString(string helloTo)
        {
            using (var scope = _tracer.BuildSpan("format-string").StartActive(true))
            {
                using WebClient webClient = new WebClient();
                var url = $"http://localhost:8081/api/format/{helloTo}";
                var helloString = webClient.DownloadString(url);
                var span = scope.Span
                    .SetTag(Tags.SpanKind, Tags.SpanKindClient)
                    .SetTag(Tags.HttpMethod, "GET")
                    .SetTag(Tags.HttpUrl, url);

                var dictionary = new Dictionary<string, string>();
                _tracer.Inject(span.Context, BuiltinFormats.HttpHeaders, new TextMapInjectAdapter(dictionary));
                foreach (var entry in dictionary)
                    webClient.Headers.Add(entry.Key, entry.Value);
                return helloString;
            }
        }
SetTag 可以设置标签,我们为本次请求到 Web 的 Span,设置一个标签,并且存储请求的 URL。
                var span = scope.Span
                    .SetTag(Tags.SpanKind, Tags.SpanKindClient)
                    .SetTag(Tags.HttpMethod, "GET")
                    .SetTag(Tags.HttpUrl, url);
通过 Inject 将上下文信息注入。
_tracer.Inject(span.Context, BuiltinFormats.HttpHeaders, new TextMapInjectAdapter(dictionary));
这些配置规范,可以到 https://github.com/opentracing/specification/blob/master/semantic_conventions.md 了解。
在 ASP.NET Core 中跟踪
在上面,我们实现了 Client 在不同进程的追踪,但是还没有实现在 Server 中跟踪,我们可以修改 Startup.cs 中的代码,将以下代码替换进去:
using Jaeger;
using Jaeger.Samplers;
using Microsoft.AspNetCore.Builder;
using Microsoft.Extensions.Configuration;
using Microsoft.Extensions.DependencyInjection;
using Microsoft.Extensions.Logging;
using OpenTracing.Util;
using System;

namespace WebApplication1
{
    public class Startup
    {
        private static readonly ILoggerFactory loggerFactory = LoggerFactory.Create(builder => builder.AddConsole());
        private static readonly Lazy<Tracer> Tracer = new Lazy<Tracer>(() =>
        {
            return InitTracer("webService", loggerFactory);
        });
        private static Tracer InitTracer(string serviceName, ILoggerFactory loggerFactory)
        {
            var samplerConfiguration = new Configuration.SamplerConfiguration(loggerFactory)
                .WithType(ConstSampler.Type)
                .WithParam(1);

            var reporterConfiguration = new Configuration.ReporterConfiguration(loggerFactory)
                .WithLogSpans(true);

            return (Tracer)new Configuration(serviceName, loggerFactory)
                .WithSampler(samplerConfiguration)
                .WithReporter(reporterConfiguration)
                .GetTracer();
        }
        public Startup(IConfiguration configuration)
        {
            Configuration = configuration;
        }

        public IConfiguration Configuration { get; }

        // This method gets called by the runtime. Use this method to add services to the container.
        public void ConfigureServices(IServiceCollection services)
        {
            services.AddMvc();

            GlobalTracer.Register(Tracer.Value);
            services.AddOpenTracing();
        }

        // This method gets called by the runtime. Use this method to configure the HTTP request pipeline.
        public void Configure(IApplicationBuilder app)
        {
            app.UseRouting();
            app.UseEndpoints(endpoints =>
            {
                endpoints.MapControllerRoute(
                    name: "default",
                    pattern: "{controller=Home}/{action=Index}/{id?}");
            });
        }
    }
}
这样不同的进程各种都可以实现追踪。
OpenTracing API 和 Jaeger
OpenTracing 是开放式分布式追踪规范,OpenTracing API 是一致,可表达,与供应商无关的API,用于分布式跟踪和上下文传播。
Jaeger 是 Uber 开源的分布式跟踪系统。
OpenTracing 的客户端库以及规范,可以到 Github 中查看:https://github.com/opentracing/
详细的介绍可以自行查阅资料。
这里我们需要部署一个 Jaeger 实例,以供微服务以及事务跟踪学习需要。
使用 Docker 部署很简单,只需要执行下面一条命令即可:
docker run -d -p 5775:5775/udp -p 16686:16686 -p 14250:14250 -p 14268:14268 jaegertracing/all-in-one:latest
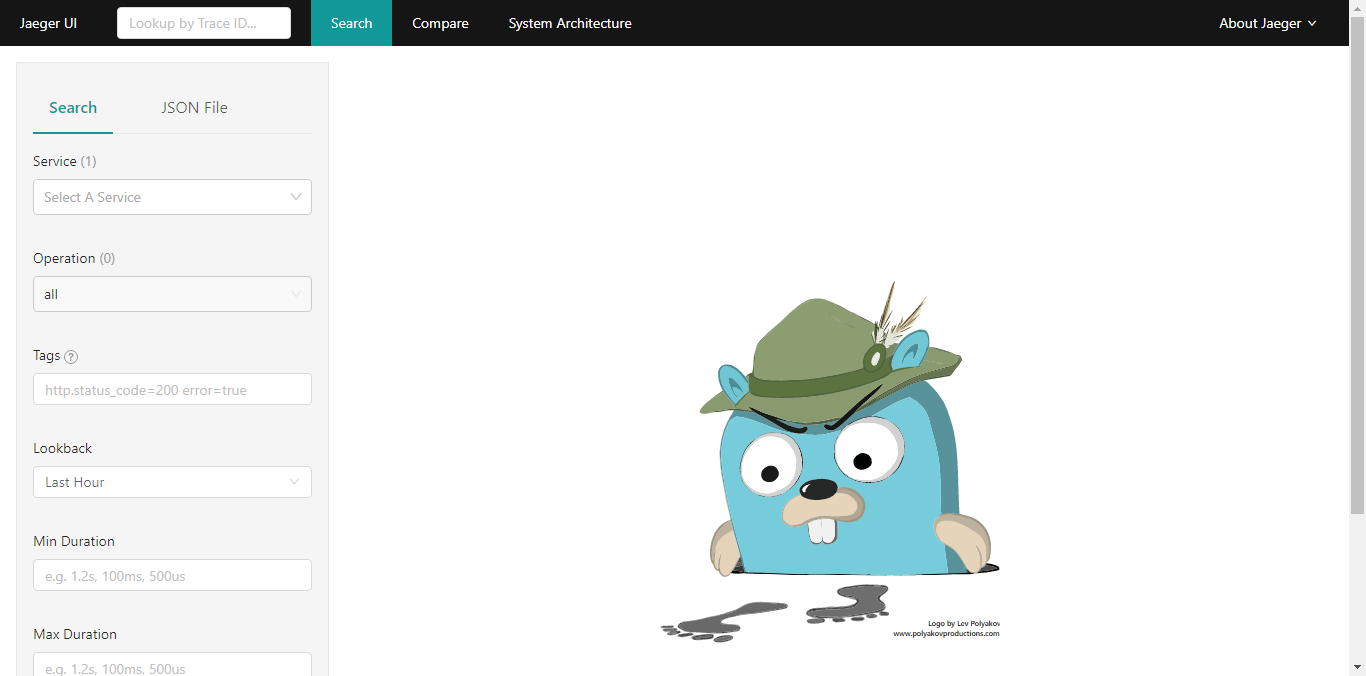
访问 16686 端口,即可看到 UI 界面。
Jaeger 的端口作用如下:
Collector
14250 tcp  gRPC 发送 proto 格式数据
14268 http 直接接受客户端数据
14269 http 健康检查
Query
16686 http jaeger的UI前端
16687 http 健康检查
接下来我们将学习如何通过代码,将数据上传到 Jaeger 中。
链路追踪实践
要注意,数据上传到 Jaeger ,上传的是 Span,是不会上传日志内容的。
继续使用上面的控制台程序,Nuget 中添加 Jaeger.Senders.Grpc 包。
我们可以通过 UDP (6831端口)和 gRPC(14250) 端口将数据上传到 Jaeger 中,这里我们使用 gRPC。
修改控制台程序的 InitTracer 方法,其代码如下:
        private static Tracer InitTracer(string serviceName, ILoggerFactory loggerFactory)
        {
            Configuration.SenderConfiguration.DefaultSenderResolver = new SenderResolver(loggerFactory)
                .RegisterSenderFactory<GrpcSenderFactory>();

            var reporter = new RemoteReporter.Builder()
                .WithLoggerFactory(loggerFactory)
                .WithSender(new GrpcSender("180.102.130.181:14250", null, 0))
                .Build();

            var tracer = new Tracer.Builder(serviceName)
                .WithLoggerFactory(loggerFactory)
                .WithSampler(new ConstSampler(true))
                .WithReporter(reporter);

            return tracer.Build();
        }
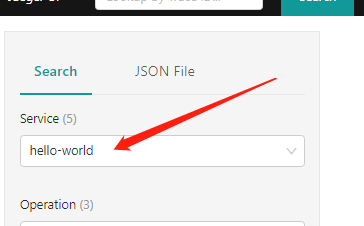
分别启动 Web 和 控制台程序,然后打开 Jaeger 界面,在 ”Service“ 中选择 hello-world,然后点击底下的 Find Traces。
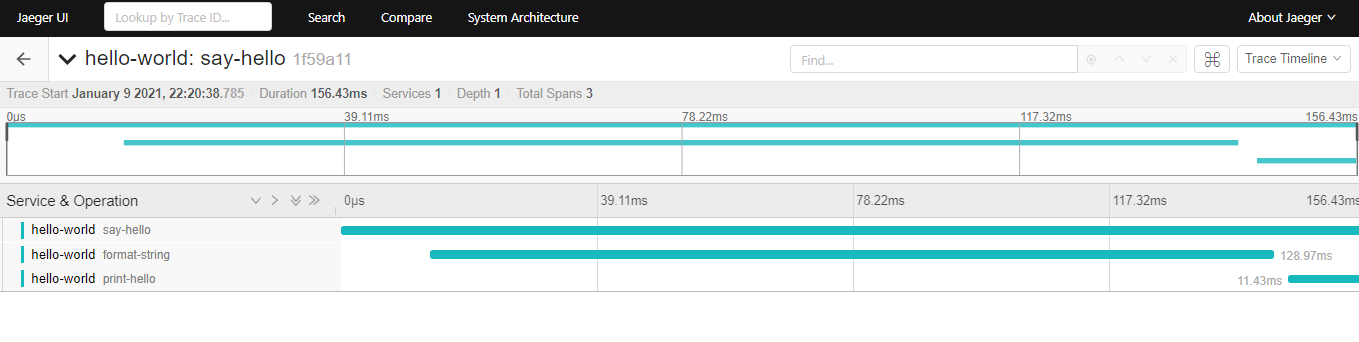
通过 Jaeger ,我们可以分析链路中函数的执行速度以及服务器性能情况。

文章评论