This series comprises three articles:
- Logging and Distributed Tracing in .NET Core
- Basic Implementation Principles of Distributed Tracing Framework (Current)
- Open sourcing a simple Jaeger-compatible framework
Lemon (Lemon丶) launched the Lemon Research Institute in January, guiding members in learning about distributed and cloud-native technologies. This month's topic is distributed tracing, focusing on studying the Dapper paper, using Jaeger, and creating a Jaeger-compatible tracing framework.
The author has divided the assignment into three parts, with this article being the second part, including implementation code.
Distributed Tracing
What is Distributed Tracing
Distributed Systems
When we use Google or Baidu for searching, the query service distributes keywords to multiple query servers, each searching within its index range, allowing the search engine to obtain a large number of accurate results in a short time. Simultaneously, based on the keywords, the advertising subsystem pushes appropriate related ads and obtains website weight from the bidding ranking subsystem. Typically, a single search may involve thousands of servers and many different systems providing services.
Multiple computers connected via a network form a large system, which is called a distributed system.
In microservices or cloud-native development, it is generally believed that distributed systems are connected by various middleware/service meshes, which provide shared resources, functions (like APIs), files, etc., enabling the entire network to act as a single computer.
Distributed Tracing
In distributed systems, a user's request is dispatched to multiple subsystems, processed by different services, and the results are returned to the user. The time from when the user makes a request to when they get the result constitutes a request cycle.
When we shop, it involves a very simple process:
Get coupon -> Place order -> Make payment -> Wait for delivery
However, in the backend system, each step requires collaboration among multiple subsystems and follows a strict process. For example, when placing an order, it needs to check whether there are any coupons, whether the coupon can be used for the current product, and whether the current order meets the conditions for using the coupon.
The diagram below illustrates the process of the system handling a user request.
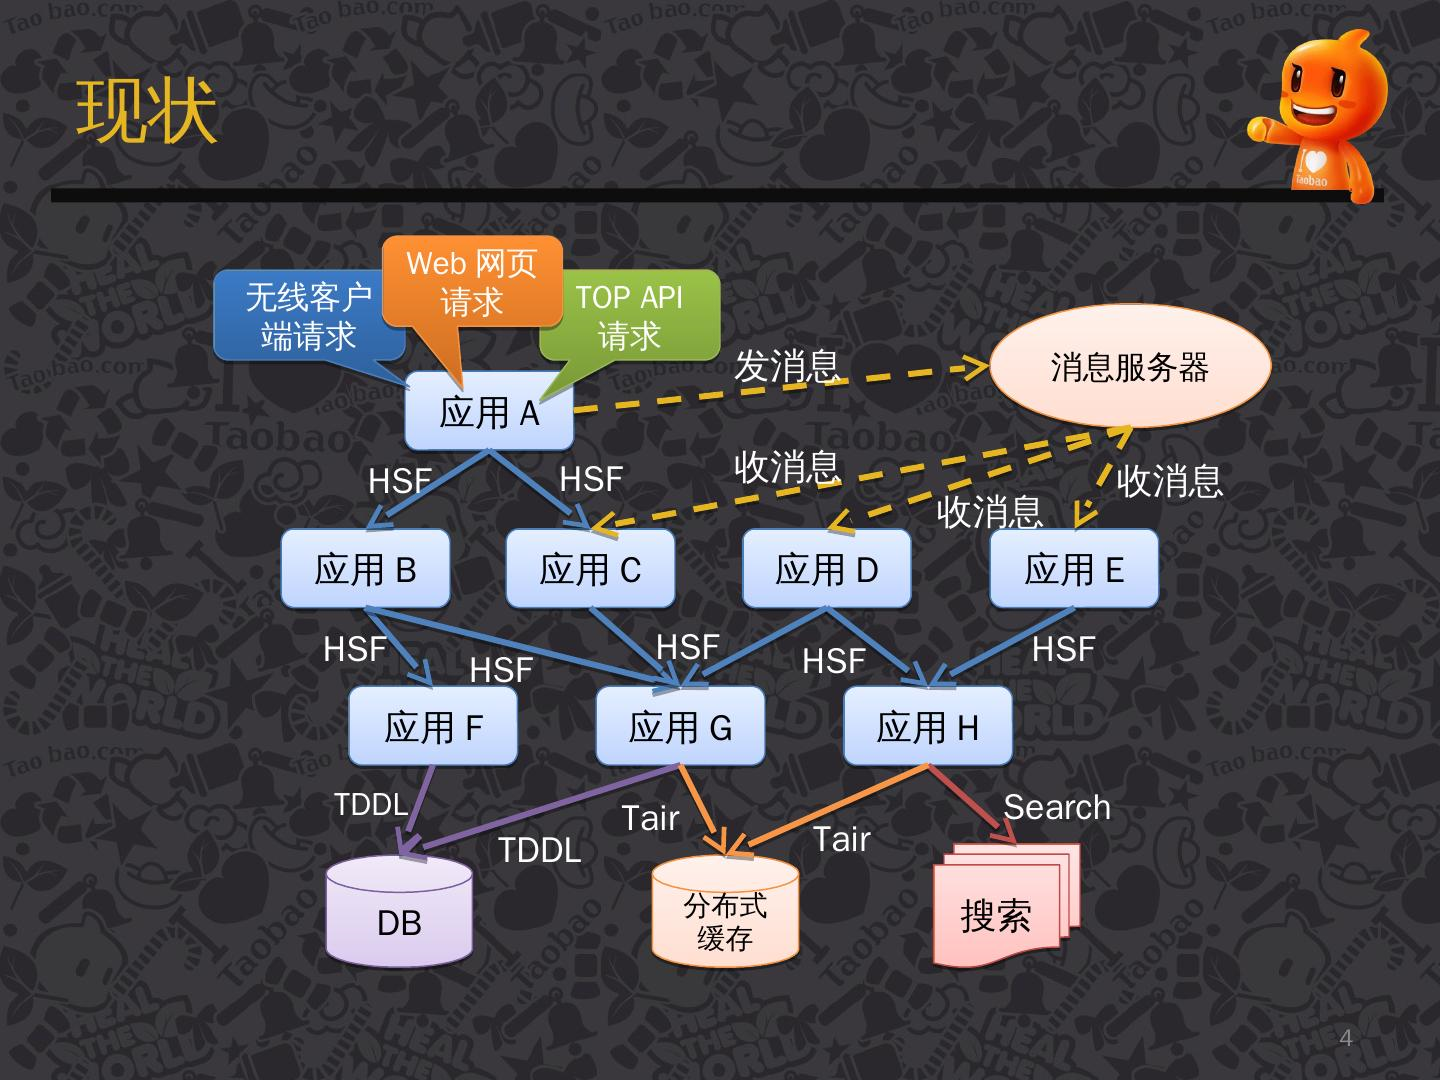
【Image Source: An Introduction to Taobao's Distributed Call Tracing System under Eagle Eye】
The arrows in the image indicate the next services/subsystems that the request will flow through, forming a link network.
In a complex distributed system, any subsystem experiencing performance issues can affect the entire request cycle. Based on the above diagram, we can consider:
- New services may be added or old services removed every day, or upgrades may occur. When errors appear in the system, how do we locate the problem?
- When a user request is slow to respond, how do we pinpoint the issue?
- Services may be developed in different programming languages; are the methods for locating problems in 1 and 2 suitable for all programming languages?
What is the Use of Distributed Tracing
With the rise of microservices and cloud-native development, more applications are being built on distributed architectures. However, when large applications are broken down into microservices, the dependencies and calls between services become increasingly complex, often developed by different teams using different languages and deployed on different machines with varying interfaces (e.g., gRPC, RESTful APIs).
To maintain these services, the software field has developed the concept of Observability, which divides maintenance of microservices into three parts:
- Metrics: Used for monitoring and alerting
- Distributed Tracing: Used to record all tracking information in the system
- Logging: Records discrete information in each service
These three parts are not independent; for example, Metrics can monitor whether the Tracing and Logging services are running normally. Tracing and Metrics services generate logs during operation.
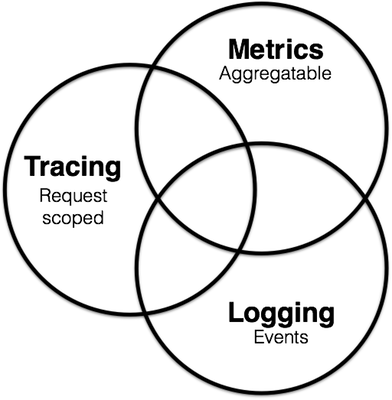
For further understanding, please click here: https://peter.bourgon.org/blog/2017/02/21/metrics-tracing-and-logging.html
In recent years, APM systems have been introduced. APM, known as Application Performance Management systems, can monitor and analyze software performance. APM is a type of Metrics, but there is a trend to integrate Tracing as well.
Returning to the main topic, what is the use of a distributed tracing system (Tracing)? Using Jaeger as an example, it can:
- Transmit distributed tracing information
- Monitor distributed transactions
- Analyze service dependencies
- Display cross-process call chains
- Locate issues
- Optimize performance
Jaeger needs to be combined with the backend for result analysis. Jaeger has a Jaeger UI, but its functionality is limited; thus, it relies on Metrics frameworks for visualization and custom monitoring and alerting rules. Therefore, it is natural that Metrics may also handle aspects of Tracing.
Dapper
Dapper is a distributed tracing system used internally by Google and is not open-source. However, Google has published a paper titled "Dapper, a Large-Scale Distributed Systems Tracing Infrastructure," which discusses the theories of distributed tracing and the design principles behind Dapper.
Many tracing systems have been built based on the Dapper paper, such as Taobao's Eagle Eye, Twitter's Zipkin, Uber's open-source Jaeger, and the distributed tracing standard OpenTracing, among others.
Paper link:
https://static.googleusercontent.com/media/research.google.com/en//archive/papers/dapper-2010-1.pdf
Translation:
http://bigbully.github.io/Dapper-translation/
If you cannot access github.io, you can clone the repository to view it https://github.com/bigbully/Dapper-translation/tree/gh-pages
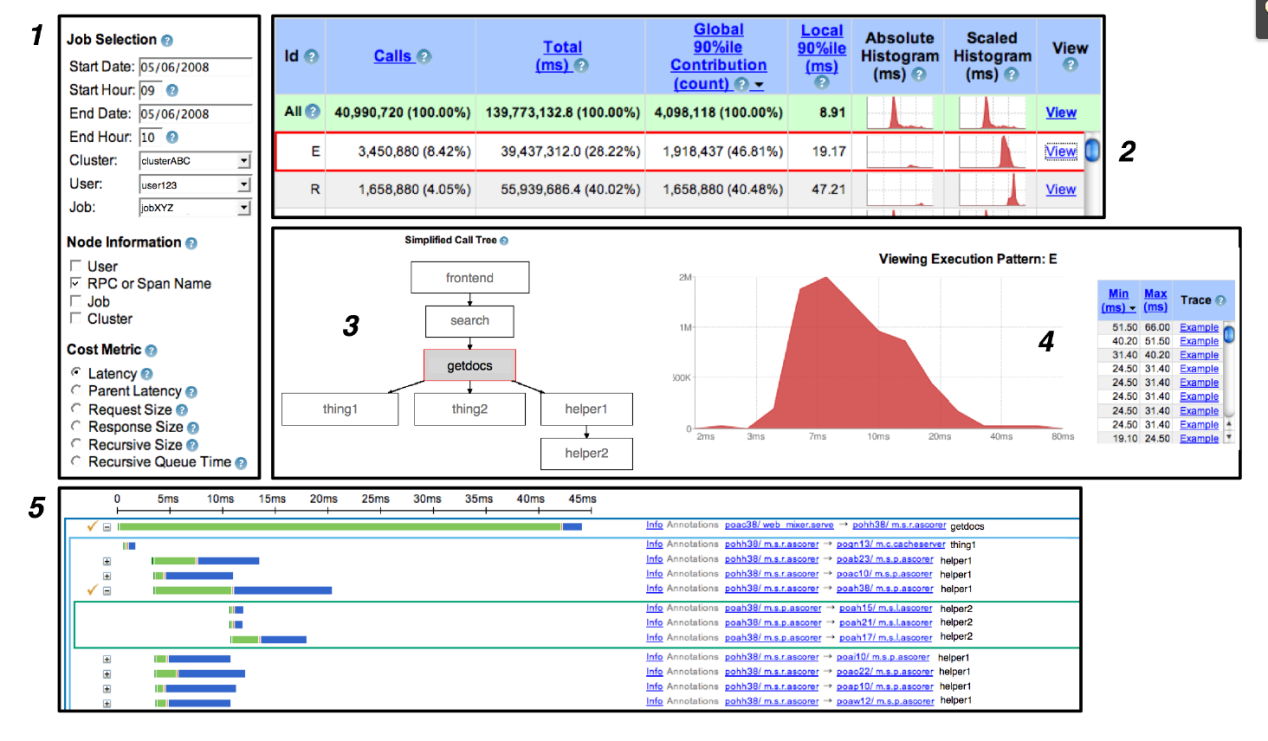
Dapper User Interface:
Implementation of Distributed Tracing Systems
The diagram below illustrates a distributed system initiated by a user X request that traverses multiple services. A, B, C, D, and E represent different subsystems or processing steps.
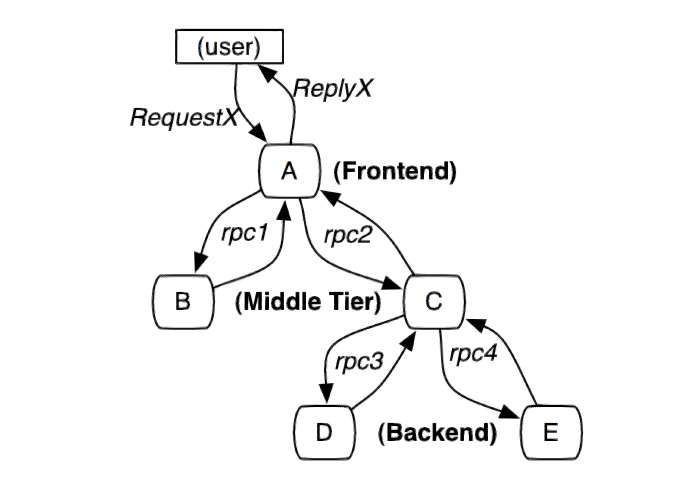
In this diagram, A is the frontend, B and C are the middle layers, and D and E are the backend of C. These subsystems are connected via RPC protocols, such as gRPC.
A simple yet practical implementation of a distributed tracing system involves collecting tracking identifiers (message identifiers) and timestamps (timestamped events) for every request and response on the server.
The tracing system of distributed services needs to record information about all work completed in the system following a particular request. User requests can be parallel, with many actions potentially being processed concurrently. A single request may traverse multiple services in the system, continuously generating various tracking information. It is crucial to associate the tracking information generated by a request across different services.
To link all recorded entries to a given initiator X and document all information, two solutions currently exist: black-box and annotation-based monitoring schemes.
Black-box solution:
This assumes that there is no additional information to track beyond the above, utilizing statistical regression techniques to infer relationships between two parties.
Annotation-based solution:
This relies on the application or middleware explicitly marking a global ID to connect each record to the initiator's request.
Pros and Cons:
While the black-box solution is lighter than the annotation-based solution, it requires more data to achieve sufficient accuracy due to its reliance on statistical inference. The main drawback of annotation-based solutions is the need for code instrumentation. In our production environment, because all applications use the same threading model, control flow, and RPC systems, we find it possible to limit code instrumentation to a small common component library, thus making the monitoring system effectively transparent to developers.
Dapper adopts the annotation-based approach, and we will now introduce some concepts related to Dapper.
Trace Tree and Span
Formally, Dapper's tracing model employs a tree structure, spans, and annotations.
In previous images, we can see that the entire request network is a tree structure, with the user request as the root node. In Dapper's tracing tree structure, tree nodes represent the fundamental units of the entire architecture.
A span refers to the duration between the receipt of a request and its completion in a node; it records various information generated during this process. Each node generates a unique span ID for every request it processes. When A -> C -> D occurs, multiple consecutive spans will create parent-child relationships; thus, a span not only saves its span ID but also needs to associate with parent and child span IDs. Generating span IDs must be high-performance and clearly indicate the temporal sequence, which will be elaborated on when introducing Jaeger.
An annotation is additional tracking detail added to a span, helping us monitor system behavior or debug issues. Annotations can include any relevant content.
Thus far, we have provided a brief introduction to some concepts of distributed tracing and Dapper; however, this is insufficient for rigorously covering the knowledge and concepts of distributed tracing. Readers are encouraged to read the Dapper paper when possible.
To implement Dapper, code instrumentation, sampling, and trace collection are also required; these will not be elaborated on here as they will be covered later, and the readers can also refer to the paper.
Jaeger and OpenTracing
OpenTracing
OpenTracing is a language-agnostic API and tool for distributed tracing. It provides not only a unified standard API but also various tools to help developers or service providers develop their programs.
OpenTracing provides an SDK for standard APIs that supports the following languages: Go, JavaScript, Java, Python, Ruby, PHP, Objective-C, C++, C#.
Of course, we can also encapsulate our SDK based on the communication protocol.
Readers can refer to the OpenTracing documentation: https://opentracing.io/docs/
Next, we need to understand some concepts and knowledge points in OpenTracing gradually. Since Jaeger is the best implementation of OpenTracing, subsequent discussions about Jaeger will inherently pertain to OpenTracing without needing strict differentiation.
Jaeger Structure
First, regarding the JAEGER component, this part deals with code instrumentation and related processes in distributed systems. After a trace is completed, the data is pushed to the jaeger-collector through jaeger-agent. The jaeger-collector handles the tracing information pushed from various sources and stores it in the backend, which can be ES, databases, etc. Jaeger-UI allows users to visualize the analyzed tracing information.
The OpenTracing API is encapsulated as SDKs for different programming languages (jaeger-client), such as a .dll for C# or a .jar for Java. Application code calls APIs to implement code instrumentation.
Jaeger-Agent is a network daemon that listens on a UDP port to receive span data, which it then batches and sends to the collector.
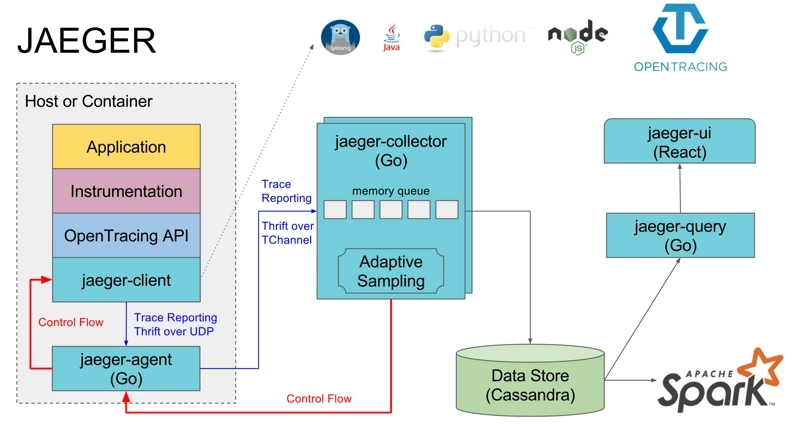
【Image Source: https://segmentfault.com/a/1190000011636957】
OpenTracing Data Model
In OpenTracing, tracing information is divided into two core elements: Trace and Span. They are stored structurally, making them the foundational components of the OpenTracing data model.
A Trace represents a complete tracing, consisting of multiple Spans. The following diagram provides an example of a Trace composed of 8 Spans.
        [Span A]  ←←←(the root span)
            |
     +------+------+
     |             |
 [Span B]      [Span C] ←←←(Span C is a `ChildOf` Span A)
     |             |
 [Span D]      +---+-------+
               |           |
           [Span E]    [Span F] >>> [Span G] >>> [Span H]
                                       ↑
                                       ↑
                                       ↑
                         (Span G `FollowsFrom` Span F)
Tracing:
a Trace can be thought of as a directed acyclic graph (DAG) of Spans.
It's a bit difficult to translate, but the gist is that a Trace consists of multiple Spans forming a directed acyclic graph.
In the example above, a Trace involves 8 services, where A -> C -> F -> G has a strict order, but in terms of timing, B and C can occur in parallel. To accurately represent the timing relationship of these Spans, we can illustrate as follows:
––|–––––––|–––––––|–––––––|–––––––|–––––––|–––––––|–––––––|–> time

 [Span A···················································]
   [Span B··············································]
      [Span D··········································]
    [Span C········································]
         [Span E·······]        [Span F··] [Span G··] [Span H··]
One important note: A -> C -> F does not mean A completes before C starts; rather, A is in a state that depends on C, and C depends on F. Therefore, when the process involving A completes, it ultimately returns to A for further execution. Hence, Span A has the longest duration.
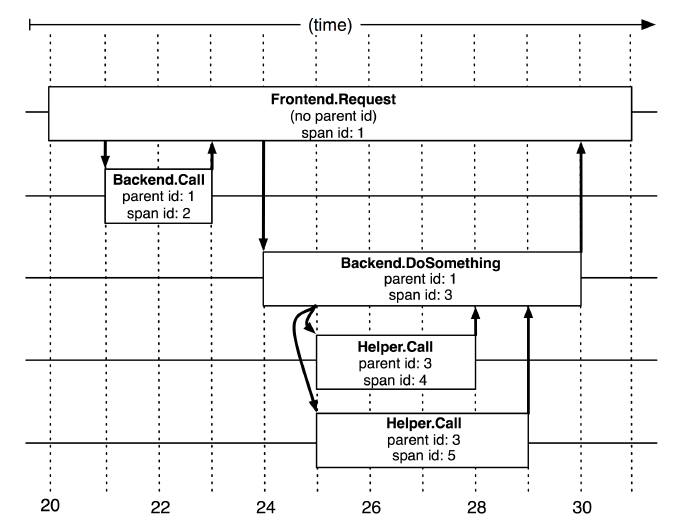
Span Format
To delve deeper, readers should carefully examine the image and JSON below:
JSON link: https://github.com/whuanle/DistributedTracing/issues/1
Subsequent explanations will revolve around this image and JSON to illustrate knowledge related to Spans.
Trace
A simplified Trace structure is as follows:
Note: The field names vary in different programming languages; the formats for gRPC and RESTful API also differ.
            "traceID": "790e003e22209ca4",
            "spans":[...],
            "processes":{...}
As previously discussed, a Trace in OpenTracing is represented as a directed acyclic graph. Therefore, a Trace must have and can have only one starting point.
This starting point creates a Trace object, which initializes the trace ID and process at the outset. The trace ID is a string composed of 32 characters, representing a timestamp, while the process contains the host information of the starting point.
Allow me to share how the trace ID is generated. The trace ID is composed of 32 characters, but effectively only 16 are used, so please understand this process with a focus on 16 characters in length.
First, obtain the current timestamp, for instance, 1611467737781059, which contains 16 digits in microseconds, representing the time 2021-01-24 13:55:37. The fractional part of the seconds is omitted for simplicity.
In C#, the code to convert the current time to this timestamp is as follows:
        public static long ToTimestamp(DateTime dateTime)
        {
            DateTime dt1970 = new DateTime(1970, 1, 1, 0, 0, 0, 0);
            return (dateTime.Ticks - dt1970.Ticks)/10;
        }

// Result: 1611467737781059
Using a GUID generator or string storage would consume performance and memory. However, using long can accurately represent the timestamp while economizing on memory.
Once this timestamp is obtained, it must be transmitted to the Jaeger Collector as byte data. Though the reasoning behind this is not entirely clear, it must be transmitted as required.
Convert the long to a byte array:
            var bytes = BitConverter.GetBytes(time);
            // Endianness
            if (BitConverter.IsLittleEndian)
            {
                Array.Reverse(bytes);
            }
A long occupies 8 bytes; the byte values are as follows:
0x00 0x05 0xb9 0x9f 0x12 0x13 0xd3 0x43
The data is then sent to Jaeger Collector. To express this binary string as a trace ID:
First, revert it back to long, then convert the long to a 16 hexadecimal string:
Convert to string (this is C#):
Console.WriteLine(time.ToString("x016"));
Result:
0005b99f1213d343
The span ID is generated similarly, with each ID being time-related, ensuring its uniqueness in the generated string.
这就是 trace 中的 trace id 了,而 trace process 是发起请求的机器的信息,用 Key-Value 的形式存储信息,其格式如下:
{
    "key": "hostname",
    "type": "string",
    "value": "Your-PC"
},
{
    "key": "ip",
    "type": "string",
    "value": "172.6.6.6"
},
{
    "key": "jaeger.version",
    "type": "string",
    "value": "CSharp-0.4.2.0"
}
Ttace 中的 trace id 和 process 这里说完了,接下来说 trace 的 span。
Span
Span 由以下信息组成:
- An operation name:操作名称,必有;
- A start timestamp:开始时间戳,必有;
- A finish timestamp:结束时间戳,必有;
- Span Tags.:Key-Value 形式表示请求的标签,可选;
- Span Logs:Key-Value 形式表示,记录简单的、结构化的日志,必须是字符串类型,可选;
- SpanContext :跨度上下文,在不同的 span 中传递,建立关系;
- References :引用的其它 Span;
span 之间如果是父子关系,则可以使用 SpanContext 绑定这种关系。父子关系有 ChildOf、FollowsFrom 两种表示,ChildOf 表示父 Span 在一定程度上依赖子 Span,而 FollowsFrom 表示父 Span 完全不依赖其子Span 的结果。
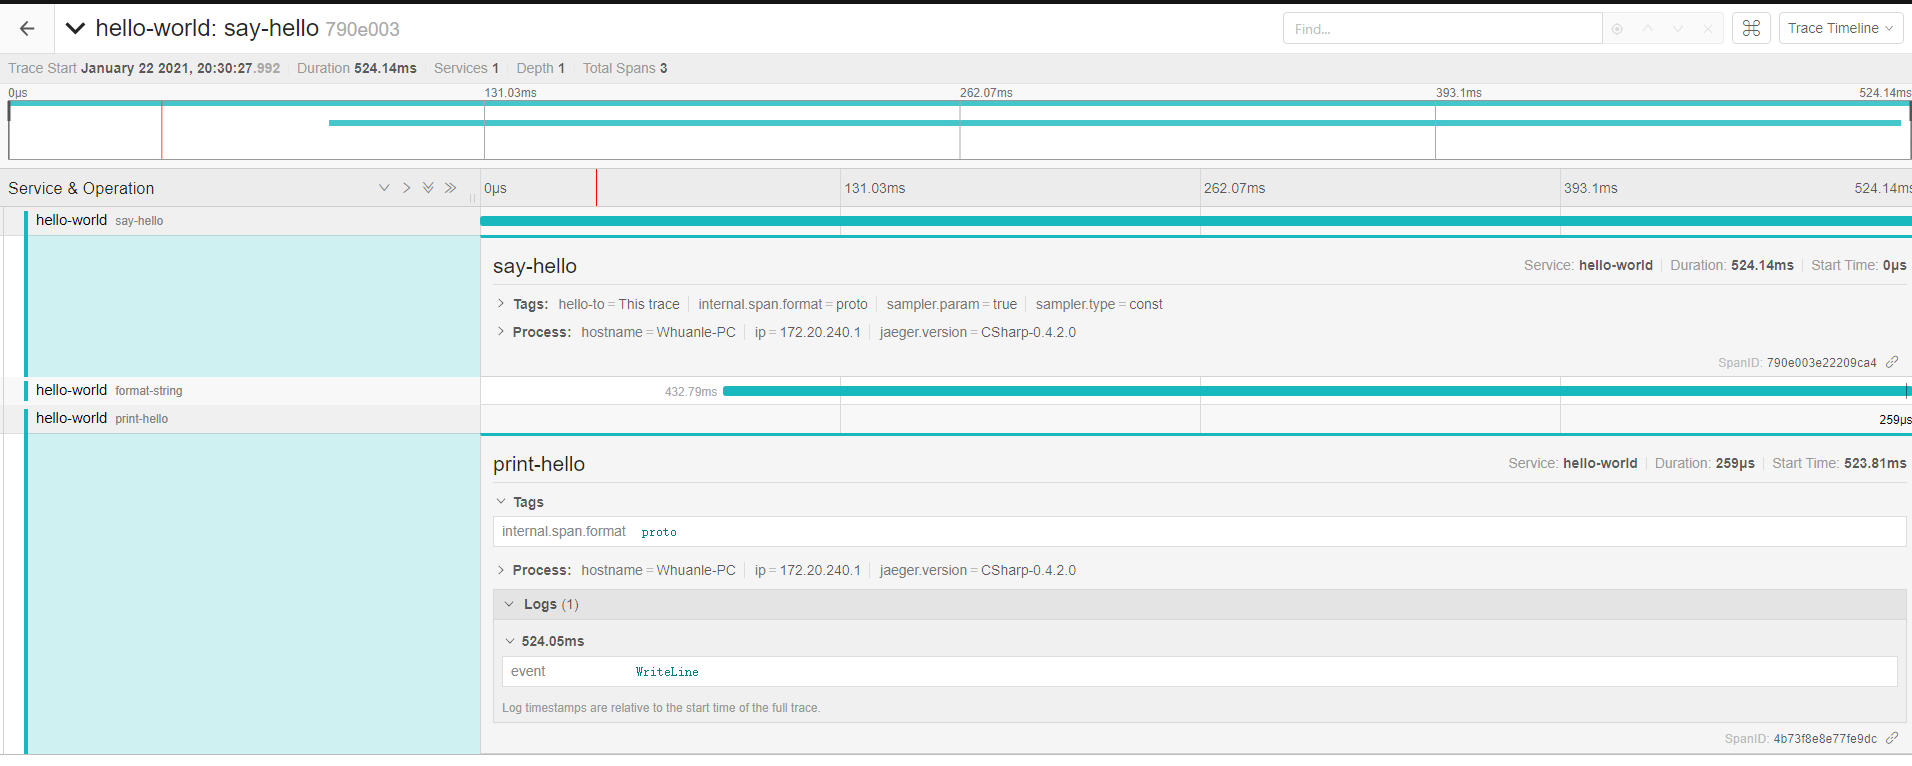
一个 Span 的简化信息如下(不用理会字段名称大小写):
{
    "traceID": "790e003e22209ca4",
    "spanID": "4b73f8e8e77fe9dc",
    "flags": 1,
    "operationName": "print-hello",
    "references": [],
    "startTime": 1611318628515966,
    "duration": 259,
    "tags": [
        {
            "key": "internal.span.format",
            "type": "string",
            "value": "proto"
        }
    ],
    "logs": [
        {
            "timestamp": 1611318628516206,
            "fields": [
                {
                    "key": "event",
                    "type": "string",
                    "value": "WriteLine"
                }
            ]
        }
    ]
}
OpenTracing API
在 OpenTracing API 中,有三个主要对象:
- Tracer
- Span
- SpanContext
Tracer可以创建Spans并了解如何跨流程边界对它们的元数据进行Inject(序列化)和Extract(反序列化)。它具有以下功能:
- 开始一个新的
Span Inject一个SpanContext到一个载体Extract一个SpanContext从载体
由起点进程创建一个 Tracer,然后启动进程发起请求,每个动作产生一个 Span,如果有父子关系,Tracer 可以将它们关联起来。当请求完成后, Tracer 将跟踪信息推送到 Jaeger-Collector中。
详细请查阅文档:https://opentracing.io/docs/overview/tracers/
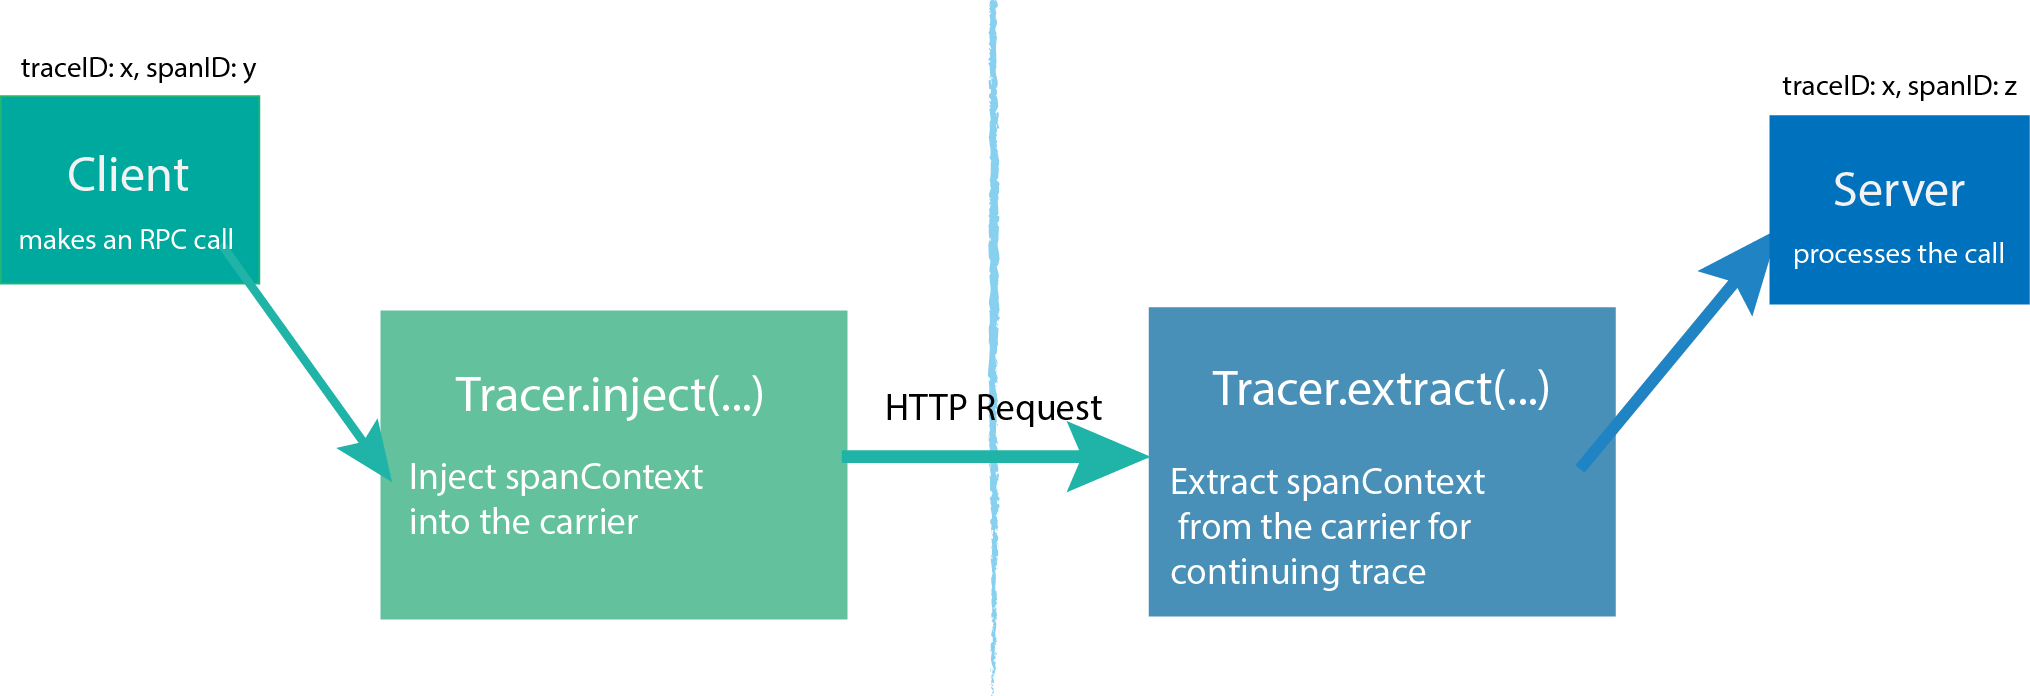
SpanContext 是在不同的 Span 中传递信息的,SpanContext 包含了简单的 Trace id、Span id 等信息。
我们继续以下图作为示例讲解。
A 创建一个 Tracer,然后创建一个 Span,代表自己 (A),再创建两个 Span,分别代表 B、C,然后通过 SpanContext 传递一些信息到 B、C;B 和 C 收到 A 的消息后,也创建一个 Tracer ,用来 Tracer.extract(...) ;其中 B 没有后续,可以直接返回结果;而 C 的 Tracer 继续创建两个 Span,往 D、E 传递 SpanContext。
这个过程比较复杂,笔者讲不好,建议读者参与 OpenTracing 的官方文档。
详细的 OpenTracing API,可以通过编程语言编写相应服务时,去学习各种 API 的使用。
.NET Core 笔者写了一篇,读者有兴趣可以阅读:【.NET Core 中的日志与分布式链路追踪】https://www.cnblogs.com/whuanle/p/14256858.html

文章评论