There are three articles in this series:
Logs and distributed link tracking in .NET Core
The basic implementation principle of the distributed link tracking framework (current)
Open source a simple framework compatible with Jaeger
Lemon (Lemon丶) opened the Lemon Research Institute in January. The research institute guides members to learn distributed and cloud-native technologies. This month’s topic is distributed Link tracking, learn Dapper papers, the use of Jaeger, and complete a link tracking framework compatible with Jaeger.
The author divides the homework into three parts, one article plus implementation code, this article is the second one.
Distributed tracking
What is distributed tracing
Distributed Systems
When we use Google or Baidu search, the query service will distribute keywords to multiple query servers, each server searches within its own index range, and the search engine can obtain a large number of accurate search results in a short time; at the same time, according to the keywords, the advertising subsystem will push appropriate relevant advertisements, and the website weight will be obtained from the bidding ranking subsystem. Usually, a search may require thousands of servers to participate, and it needs to provide services through many different systems.
Many computers form a huge system through the network, and this system is a distributed system.
In microservices or cloud-native development, it is generally considered that distributed systems are connected through various middleware/service grids. These middleware provide shared resources, functions (APIs, etc.), files, etc., so that the entire network can be used as a computer for work.
Distributed tracking
In a distributed system, a user's request will be distributed to multiple subsystems, processed by different services, and finally returned to the user. The period between the user sending the request and obtaining the result is a request cycle.
When we shop, we only need a very simple process:
Get coupons -> place an order -> pay -> wait for receipt
However, in the background system, each link needs to go through multiple subsystems for collaboration, and there are strict processes. For example, when placing an order, you need to check whether there is a coupon, whether the coupon can be used for the current product, whether the current order meets the conditions for using the coupon, etc.
The following figure is a flow of the system processing the request after a user request.
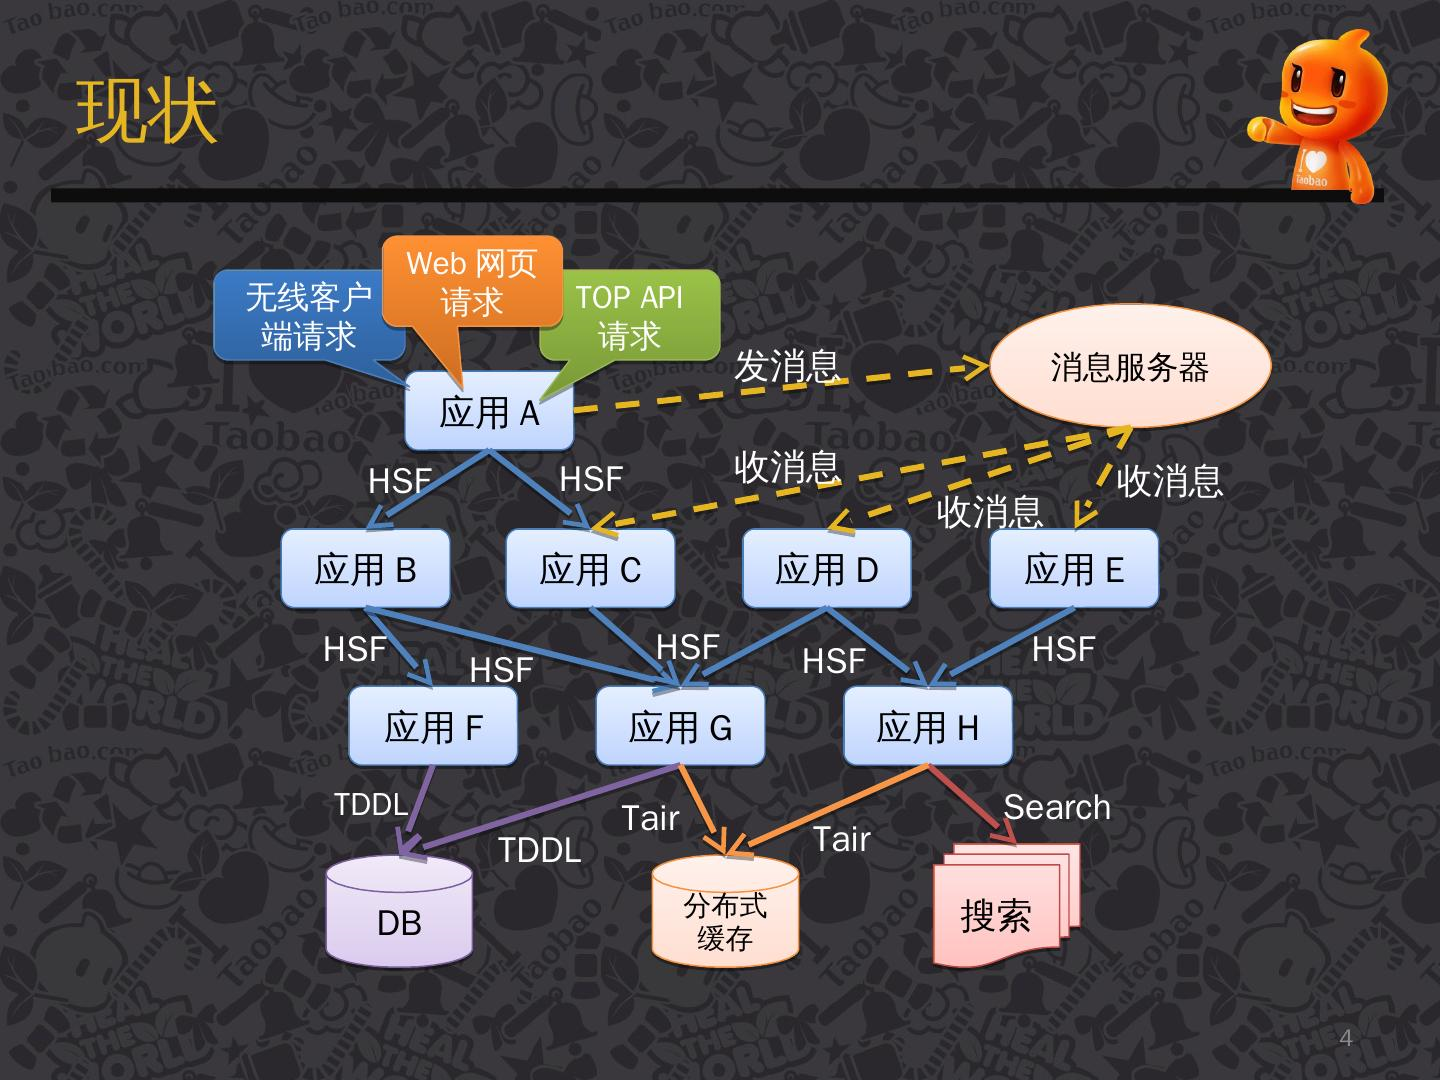
[Image source: [Introduction to Taobao Distributed Call Tracking System under Eagle Eyes] (https://www.slidestalk.com/u36/k21g5i)]
There are many arrows in the figure, these arrows point to the next service/subsystem that will flow through, and these arrows form a link network.
In a complex distributed system, the poor performance of any subsystem will affect the entire request cycle. According to the picture above, we envision:
-
The system may add new services or delete old services every day, or it may be upgraded. When the system has errors, how do we locate the problem?
-
When the user requests, the response is slow, how to locate the problem?
-
The service may be developed by different programming languages. Is the method of 1, 2 positioning the problem suitable for all programming languages?
What is the use of distributed tracing?
With the rise of microservices and cloud-native development, more and more applications are developed on a distributed basis, but after large-scale applications are split into microservices, the dependencies and calls between services become more and more complicated. These services are different teams, developed in different languages, and deployed on different machines, may provide different interfaces between them (gRPC, Restful API, etc.).
In order to maintain these services, the Observability idea appeared in the software field. In this idea, the maintenance of microservices is divided into three parts:
- Metrics (
Metrics): used for monitoring and alarm; - Distributed tracing (Tracing): used to record all tracing information in the system;
- Logging: Record the discrete information of each service;
These three parts are not independent. For example, Metrics can monitor whether the Tracing and Logging services are running normally. Tracing and Metrics services will generate logs during operation.
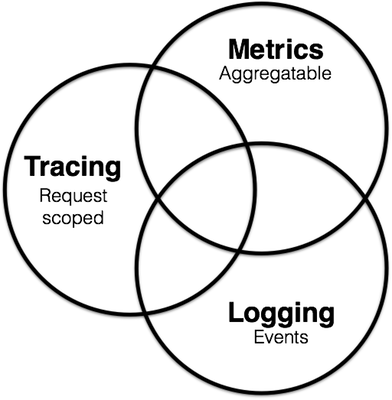
To learn more, please poke your screen: https://peter.bourgon.org/blog/2017/02/21/metrics-tracing-and-logging.html
In recent years, the APM system has emerged. APM is called an application performance management system, which can perform software performance monitoring and performance analysis. APM is a kind of Metrics, but now there is a trend of integrating Tracing.
Back to the topic, what is the use of a distributed tracing system (Tracing)? Here is an example of Jaeger, which can:
- Distributed tracking information transfer
- Distributed transaction monitoring
- Service dependency analysis
- Show cross-process call chain
- Location problem
- Performance optimization
Jaeger needs to analyze results in conjunction with the backend. Jaeger has a Jaeger UI, but it does not have many functions. Therefore, it also needs to rely on the Metrics framework to visualize the results from the presentation, as well as custom monitoring and alarm rules, so it is natural that Metrics may incorporate Tracing things have been done.
Dapper
Dapper is a distributed link tracing system used internally by Google. It is not open source. However, Google has released a "Dapper, a Large-Scale Distributed Systems Tracing Infrastructure" paper. This paper describes the theory and Dapper's design ideas.
There are many link tracking systems based on Dapper papers, such as Taobao's Hawkeye, Twitter's Zipkin, Uber's open source Jaeger, and the distributed link tracking standard OpenTracing.
Paper address:
https://static.googleusercontent.com/media/research.google.com/en//archive/papers/dapper-2010-1.pdf
Translation:
http://bigbully.github.io/Dapper-translation/
If you can’t access github.io, you can clone the warehouse to see https://github.com/bigbully/Dapper-translation/tree/gh-pages
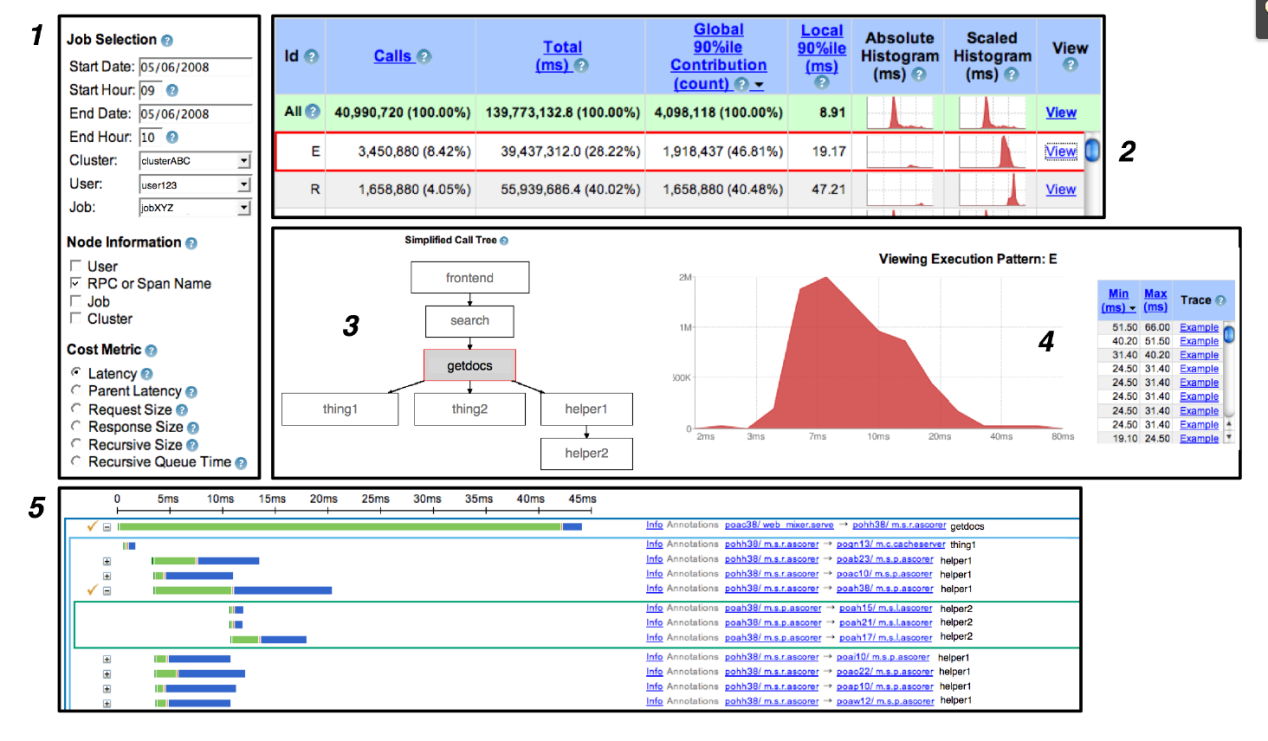
Dapper user interface:
Implementation of Distributed Tracking System
The following figure is a distributed system initiated by user X and traverses multiple services. A, B, C, D, and E represent different subsystems or processes.
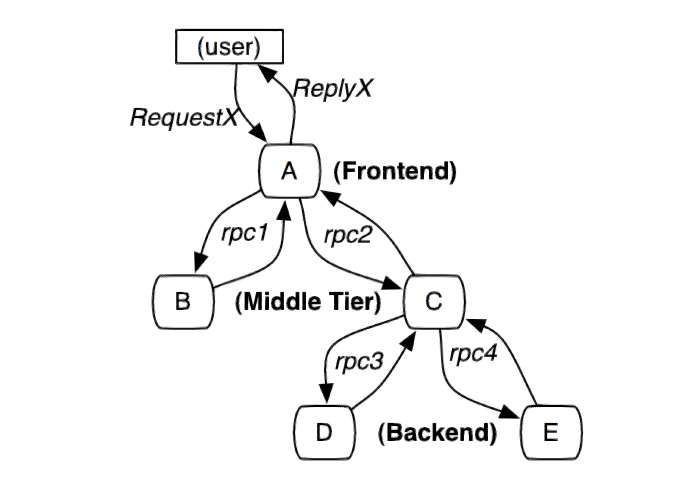
In this figure, A is the front end, B and C are the middle layer, and D and E are the back end of C. These subsystems are connected through the RPC protocol, such as gRPC.
A simple and practical implementation of a distributed link tracking system is to collect message identifiers and timestamped events for every request and response on the server.
The tracking system of distributed services needs to record information about all the work completed in the system after a specific request. User requests can be parallel. There may be a large number of actions to be processed at the same time. A request will also go through multiple services in the system. Various tracking information is generated in the system all the time. A request must be placed in different services. The generated tracking information is linked.
In order to associate all record entries with a given initiator X and record all information, there are currently two solutions, black-box and annotation-based monitoring solutions.
Black box solution:
Assuming that there is no additional information other than the above information that needs to be tracked, statistical regression techniques are used to infer the relationship between the two.
Annotation-based solution:
Rely on the application or middleware to clearly mark a global ID to connect each record with the request of the initiator.
Advantages and disadvantages:
Although black box schemes are lighter than labeling schemes, they require more data to obtain sufficient accuracy because they rely on statistical inference. The main disadvantage of the annotation-based solution is that it obviously requires code implantation. In our production environment, because all applications use the same threading model, control flow, and RPC system, we found that we can limit t
he code implantation to a small common component library, thus realizing the monitoring system The application is effectively transparent to developers.
Dapper is an annotation-based solution. Next, we will introduce some conceptual knowledge in Dapper.
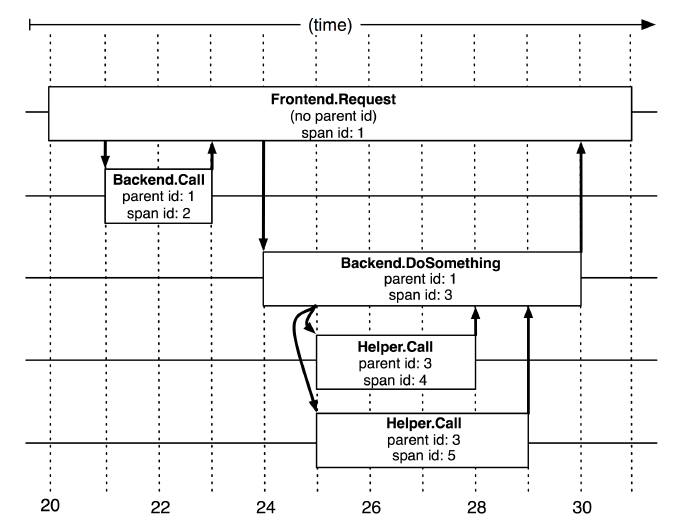
Trace tree and span
From a formal point of view, the Dapper tracking model uses a tree structure, Span and Annotation.
In the previous picture, we can see that the entire request network is a tree structure, and user requests are the root node of the tree. In Dapper's tracking tree structure, tree nodes are the basic unit of the entire architecture.
A span is called a span. The process of a node receiving a request and completing the request is a span. The span records various information generated in this process. When each node processes each request, it will generate a unique span id. When A -> C -> D, multiple consecutive spans will have a parent-child relationship. Then a span needs to be associated in addition to saving its own span id. Father and son span id. Span id generation must be high-performance, and can clearly indicate the time sequence, which will be introduced when Jaeger is introduced later.
Annotation is translated into annotation. In a span, you can add more tracking details to the span. These additional information can help us monitor the behavior of the system or help debug problems. Annotation can add any content.
So far, I have briefly introduced some distributed tracing and Dapper knowledge, but these are not enough to rigorously explain the knowledge and concepts of distributed tracing. It is recommended that readers read Dapper theory when they have time.
To implement Dapper, it also requires code embedding, sampling, and tracking collection, which will not be discussed in detail here; it will be introduced later. Readers can also refer to the paper.
Jaeger and OpenTracing
OpenTracing
OpenTracing is a vendor-independent API and tools for distributed tracing. It not only provides a unified standard API but also focuses on various tools to help developers or service providers develop programs.
OpenTracing provides access SDK for standard APIs, supporting the following languages: Go, JavaScript, Java, Python, Ruby, PHP, Objective-C, C++, C#.
Of course, we can also wrap our own SDK according to the communication protocol.
Readers can refer to the OpenTracing documentation: https://opentracing.io/docs/
Next, we need to clarify some concepts and knowledge points in OpenTracing one by one. Since Jaeger is the best implementation of OpenTracing, the following discussion on Jaeger will essentially refer to OpenTracing, and there is no need to strictly distinguish between the two.
Jaeger Structure
First, regarding the JAEGER section, this part deals with the process of code embedding and so on in distributed systems. When a trace is completed, data is pushed to the jaeger-collector via jaeger-agent. The jaeger-collector is responsible for handling the tracing information pushed from all directions and storing it to the backend, which can be stored in ES, databases, etc. Jaeger-UI allows users to view the analyzed tracing information on the interface.
The OpenTracing API is encapsulated into SDK for programming languages (jaeger-client), for example, in C# it is .dll, in Java it is .jar, and application code implements code embedding by calling APIs.
The jaeger-Agent is a network daemon that listens on a UDP port to receive span data, which it batches and sends to the collector.
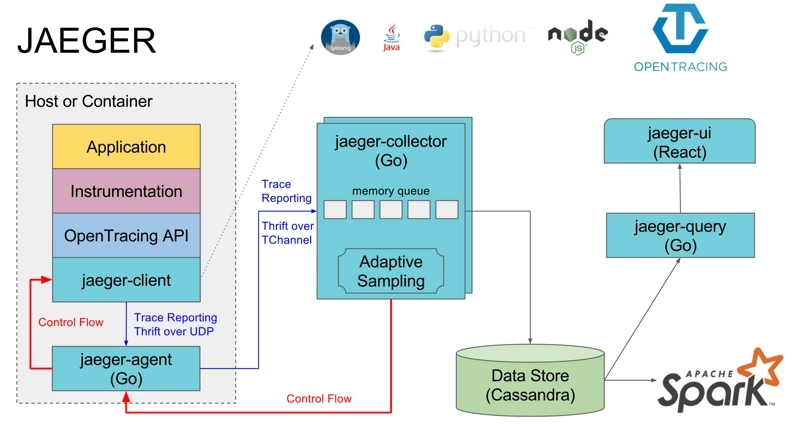
【Image Source: https://segmentfault.com/a/1190000011636957】
OpenTracing Data Model
In OpenTracing, tracing information is divided into two core components: Trace and Span, which store tracing information according to a certain structure, so they are the core of the OpenTracing data model.
A Trace is a complete tracing. A Trace consists of multiple Spans. The following diagram shows an example of a Trace, consisting of 8 Spans.
        [Span A]  ←←←(the root span)
            |
     +------+------+
     |             |
 [Span B]      [Span C] ←←←(Span C is a `ChildOf` Span A)
     |             |
 [Span D]      +---+-------+
               |           |
           [Span E]    [Span F] >>> [Span G] >>> [Span H]
                                       ↑
                                       ↑
                                       ↑
                         (Span G `FollowsFrom` Span F)
Tracing:
a Trace can be thought of as a directed acyclic graph (DAG) of Spans.
It is a bit difficult to translate, but the general idea is that a Trace is a directed acyclic graph composed of multiple Spans.
In the above example, a Trace passes through 8 services, where A -> C -> F -> G has a strict order, but in terms of time, B and C can run in parallel. To accurately represent the temporal relationships of these Spans, we can illustrate it as follows:
––|–––––––|–––––––|–––––––|–––––––|–––––––|–––––––|–––––––|–> time

 [Span A···················································]
   [Span B··············································]
      [Span D··········································]
    [Span C········································]
         [Span E·······]        [Span F··] [Span G··] [Span H··]
One important note is that A -> C -> F does not mean that A finishes executing and then C starts executing, but rather that A depends on C during its execution, and C depends on F. Therefore, after the process of A depending on C completes, it returns to A to continue execution. Thus, the span of A in the above diagram is the largest.
Span Format
To study Span in depth, readers should closely refer to the following image and JSON:
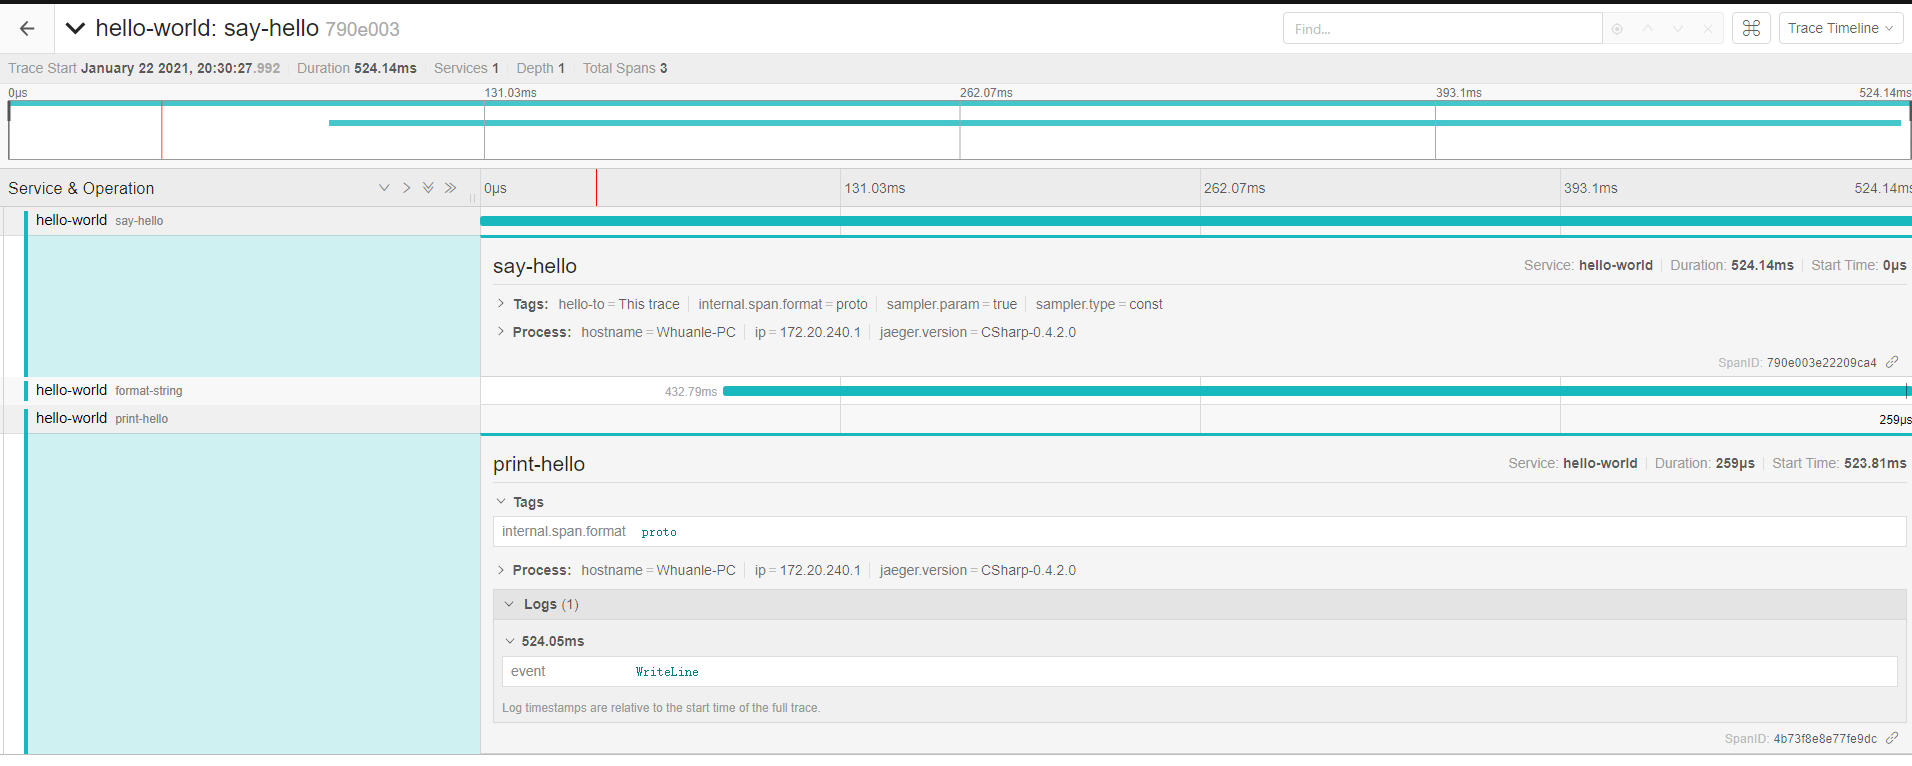
JSON source: https://github.com/whuanle/DistributedTracing/issues/1
Subsequently, we will take this image and JSON as examples to discuss knowledge related to Span.
Trace
A simplified Trace is as follows:
(Note: The field names may vary between different programming languages, and the formats of gRPC and Restful APIs may also differ.)
            "traceID": "790e003e22209ca4",
            "spans": [...],
            "processes": {...}
As mentioned earlier, in OpenTracing, a Trace is a directed acyclic graph, so a Trace must have only one starting point.
This starting point creates a Trace object, which is initialized with a trace id and process. The trace id is a 32-character string composed of a timestamp, while the process contains information about the host where the starting point process resides.
Next, I will discuss how the trace id is generated. The trace id consists of 32 characters, but in fact, only 16 are used. Therefore, please understand this process with a length of 16 characters.
First, obtain the current timestamp, for example, getting 1611467737781059, which consists of 16 digits and represents the time 2021-01-24 13:55:37 in microseconds; the units below seconds are not provided here, just to understand that it represents time.
In C#, the code to convert the current time to this timestamp is:
        public static long ToTimestamp(DateTime dateTime)
        {
            DateTime dt1970 = new DateTime(1970, 1, 1, 0, 0, 0, 0);
            return (dateTime.Ticks - dt1970.Ticks)/10;
        }

// Result: 1611467737781059
If we directly use Guid generation or string storage, it will consume some performance and memory, while using long can just represent the timestamp and save memory.
After obtaining this timestamp, it needs to be transmitted to the Jaeger Collector, which must be converted to byte data; the reasons for this are unclear, but it is a requirement for transmission.
To convert long to a byte array:
            var bytes = BitConverter.GetBytes(time);
			// Endianness
            if (BitConverter.IsLittleEndian)
            {
                Array.Reverse(bytes);
            }
Long occupies 8 bytes, and each byte value is as follows:
0x00 0x05 0xb9 0x9f 0x12 0x13 0xd3 0x43
Then, transmit this to the Jaeger Collector, and we get a string of binary data; how is this represented as a string trace id?
We can first restore it to long and then output long as a hexadecimal string:
Convert to string (in C#):
Console.WriteLine(time.ToString("x016"));
Result:
0005b99f1213d343
The Span id is generated similarly; each id is unique in time due to its association with the timestamp, and the generated string is also unique.
This is the trace id in the trace, and the trace process contains the information of the machine initiating the request in a Key-Value format, as follows:
                        {
                            "key": "hostname",
                            "type": "string",
                            "value": "Your-PC"
                        },
                        {
                            "key": "ip",
                            "type": "string",
                            "value": "172.6.6.6"
                        },
                        {
                            "key": "jaeger.version",
                            "type": "string",
                            "value": "CSharp-0.4.2.0"
                        }
This concludes the description of the trace id and process in the trace; next we will discuss the spans within the trace.
Span
Span consists of the following information:
- An operation name: operation name, must have;
- A start timestamp: start timestamp, must have;
- A finish timestamp: end timestamp, must have;
- Span Tags: Key-Value format represents the requested tag, optional;
- Span Logs: Key-Value format, to record simple and structured logs, must be of string type, optional;
- SpanContext: Span context, pass in different spans to establish relationships;
- References: other Span referenced;
If there is a parent-child relationship between spans, you can use SpanContext to bind this relationship. The parent-child relationship has ChildOf and FollowsFrom. ChildOf means that the parent Span depends on the child Span to a certain extent, and FollowsFrom means the parent Span is completely independent of the results of its child Span.
The simplified information of a Span is as follows (don't care about the case of field names):
{
                    "traceID": "790e003e22209ca4",
                    "spanID": "4b73f8e8e77fe9dc",
                    "flags": 1,
                    "operationName": "print-hello",
                    "references": [],
                    "startTime": 1611318628515966,
                    "duration": 259,
                    "tags": [
                        {
                            "key": "internal.span.format",
                            "type": "string",
                            "value": "proto"
                        }
                    ],
                    "logs": [
                        {
                            "timestamp": 1611318628516206,
                            "fields": [
                                {
                                    "key": "event",
                                    "type": "string",
                                    "value": "WriteLine"
                                }
                            ]
                        }
                    ]
}
OpenTracing API
In the OpenTracing API, there are three main objects:
- Tracer
- Span
- SpanContext
Tracer can create Spans and learn how to Inject (serialize) and Extract (deserialize) their metadata across process boundaries. It has the following functions:
- Start a new
Span InjectaSpanContextto a carrierExtractaSpanContextfrom the carrier
A Tracer is created by the starting process, and then the process is started to initiate a request. Each action generates a Span. If there is a parent-child relationship, Tracer can associate them. When the request is completed, Tracer will push the trace information to Jaeger-Collector.
For details, please refer to the document: https://opentracing.io/docs/overview/tracers/
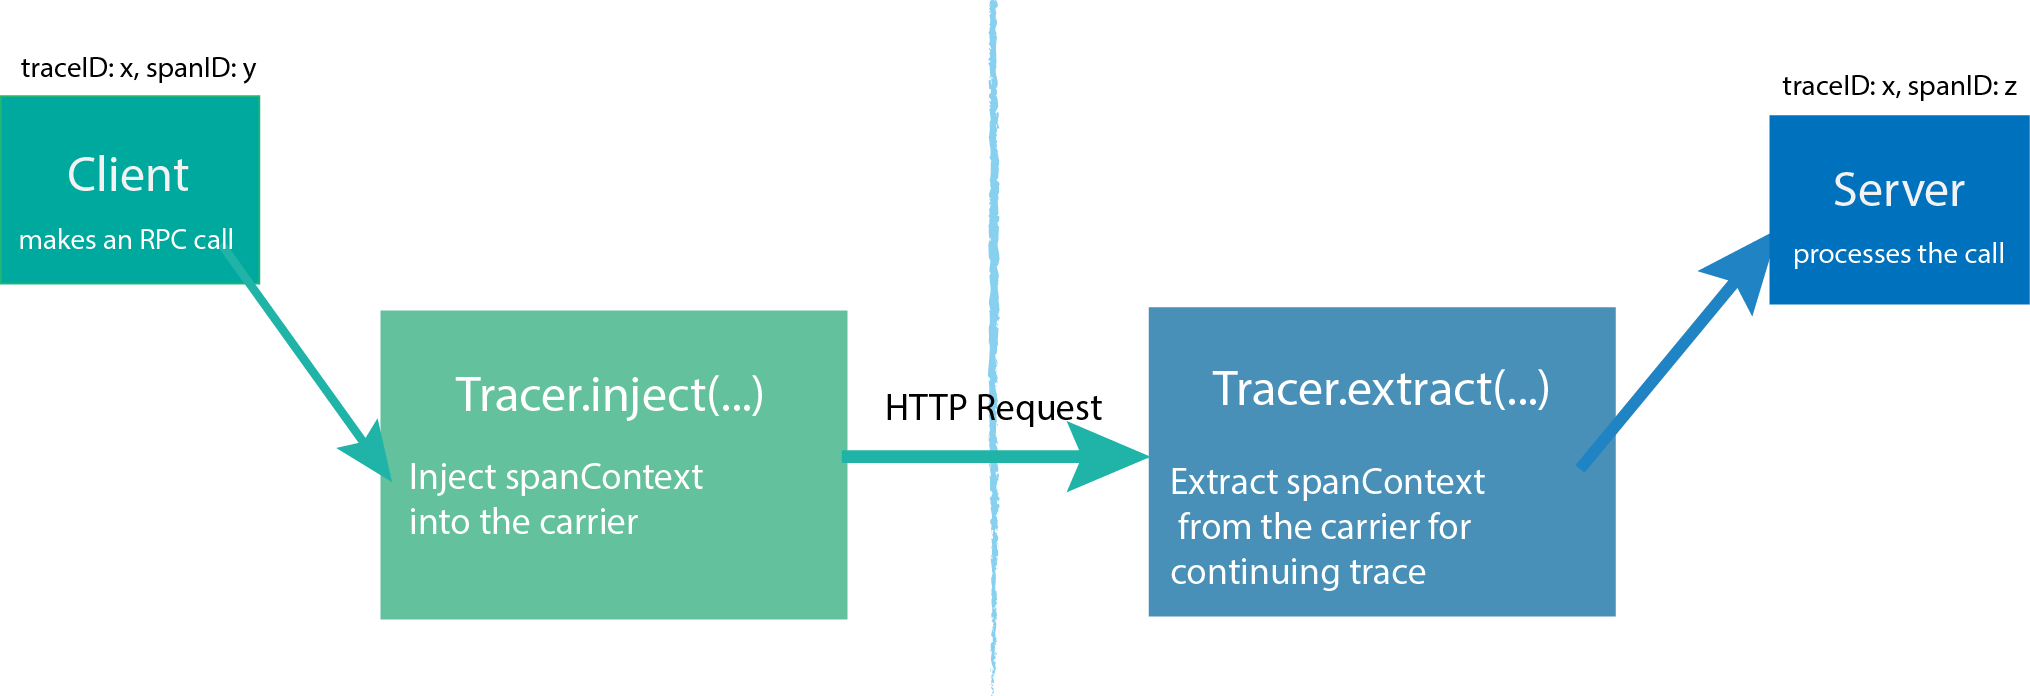
SpanContext transmits information in different Spans, and SpanContext contains simple Trace id, Span id and other information.
We continue the following figure as an example to explain.
A creates a Tracer, then creates a Span to represent itself (A), and then creates two Spans to represent B and C respectively, and then pass some information to B and C through SpanContext; after B and C receive A’s message, they also create a Tracer to use Tracer.extract(...); where B has no follow-up and can return the result directly; while Tracer of C continues to create two Spans, passing SpanContext to D and E.
This process is more complicated, and the author is not good at it. Readers are advised to participate in the official documentation of OpenTracing.
With the detailed OpenTracing API, you can learn how to use various APIs when writing corresponding services in programming languages.
The author of .NET Core wrote an article, readers who are interested can read: Logs and Distributed Link Tracking in .NET Core

文章评论