- Getting Started
- Jaeger
- Deploying Jaeger
- Understanding Jaeger Client Go through an Example
- Understanding trace and span
- Tracer Configuration
- Sampler Configuration
- Reporter Configuration
- Distributed Systems and Span
- How to Call and Pass
- HTTP and Cross-Process Tracing
- Tag, Log, and Ref
Getting Started
Previously, I participated in a free training camp by the expert Ning Meng, under whose guidance our technology continuously improved. For our assignment, we need to implement a Jaeger backend. I used .NET and MongoDB for the implementation (the expert said I would lose 10 points for using C#, sob...). The project address for the C# implementation is https://github.com/whuanle/DistributedTracing, supporting Jaeger Collector, Query, and more.
Now that I am transitioning to Go language, I'll re-implement it in Go. The next article will fully introduce how to implement a Jaeger Collector. In this article, we will first learn how to use the Jaeger Client Go and some concepts related to Jaeger Go.
Before that, I suggest readers take a quick glance at the article Basic Implementation Principles of Distributed Tracing Framework, which will help in understanding the Dapper paper and some concepts of Jaeger.
Next, we will learn about some technologies in Go step by step, and gradually expand on Jaeger Client.
Jaeger
OpenTracing is an open standard for distributed tracing, and the OpenTracing API is consistent, expressive, and vendor-neutral, designed for distributed tracing and context propagation.
You can check the OpenTracing client libraries and specifications on GitHub: https://github.com/opentracing/
Jaeger is a distributed tracing system open-sourced by Uber, and detailed information can be consulted in various resources.
Deploying Jaeger
Here, we need to deploy a Jaeger instance for microservices and for our further learning needs.
Using Docker for deployment is very simple; just execute the following command:
docker run -d -p 5775:5775/udp -p 16686:16686 -p 14250:14250 -p 14268:14268 jaegertracing/all-in-one:latest
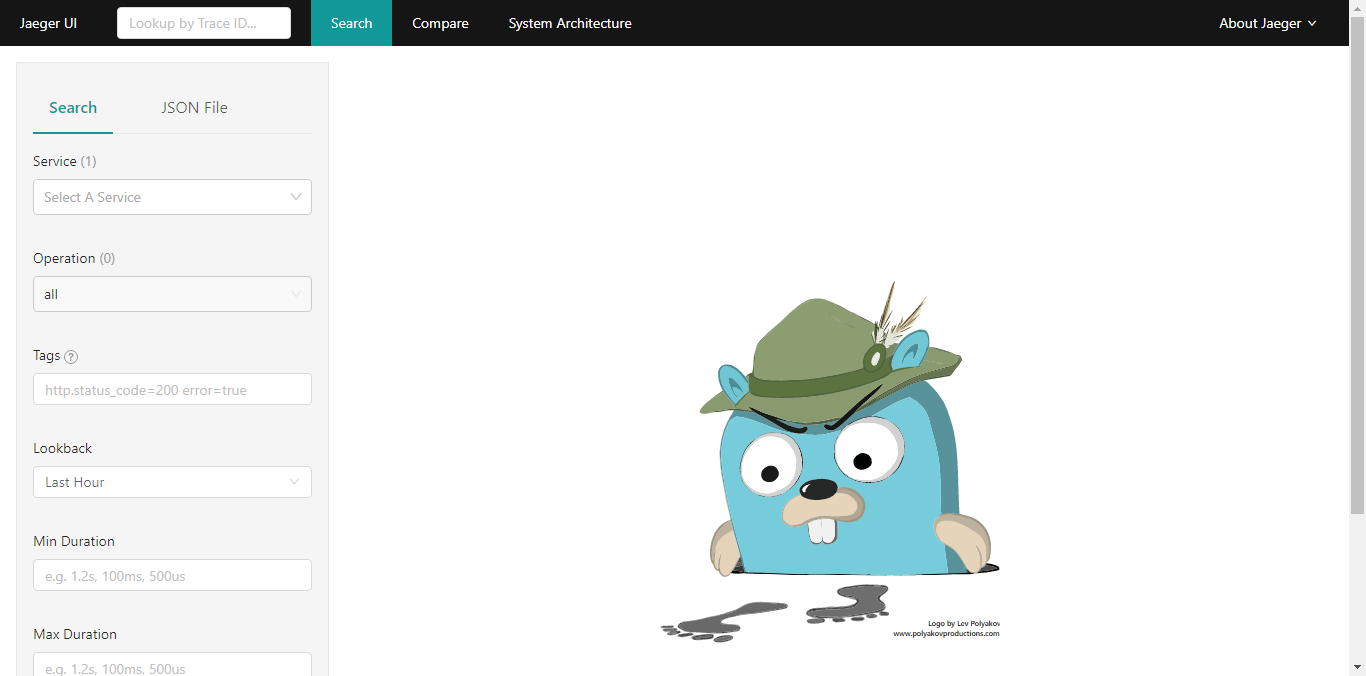
Accessing port 16686 will show the UI interface.
The tracing information we generate later will be pushed to this service, and we can query this tracing information via the Jaeger UI.
Understanding Jaeger Client Go through an Example
Here, we mainly understand some interfaces and structures of the Jaeger Client, and some code usage.
To help readers understand Trace, Span, etc., take a look at the approximate structure of this JSON:
        {
            "traceID": "2da97aa33839442e",
            "spans": [
                {
                    "traceID": "2da97aa33839442e",
                    "spanID": "ccb83780e27f016c",
                    "flags": 1,
                    "operationName": "format-string",
                    "references": [...],
                    "tags": [...],
                    "logs": [...],
                    "processID": "p1",
                    "warnings": null
                },
                ... ...
            ],
            "processes": {
                "p1": {
                    "serviceName": "hello-world",
                    "tags": [...]
                },
                "p2": ...,
            "warnings": null
        }
Create a project called client1 and import the Jaeger client package.
go get -u github.com/uber/jaeger-client-go/
Then import the package.
import (
	"github.com/uber/jaeger-client-go"
)
Understanding trace and span
In distributed tracing, a process is identified by a trace instance, while each service or function is represented by a span. The Jaeger package has a function to create an empty trace:
tracer := opentracing.GlobalTracer() // Do not use in production
Then, generate parent-child relationships of spans in the call chain:
func main() {
	tracer := opentracing.GlobalTracer()
	// Create the first span A
	parentSpan := tracer.StartSpan("A")
	defer parentSpan.Finish() // Finish can be called manually

}
func B(tracer opentracing.Tracer, parentSpan opentracing.Span) {
	// Inherit context and create a child span
	childSpan := tracer.StartSpan(
		"B",
		opentracing.ChildOf(parentSpan.Context()),
	)
	defer childSpan.Finish() // Finish can be called manually
}
Each span represents a node in the call chain, and each node must explicitly define its parent span.
We now understand how to generate trace{span1, span2}, where span1 -> span2 indicates that span1 calls or depends on span2.
Tracer Configuration
Since calls between services are cross-process, each process has certain characteristics that need to be marked. To identify these processes, we need to carry some information within the context and spans.
For example, we configure trace and service name in the first process that initiates the request:
// Import jaegercfg "github.com/uber/jaeger-client-go/config"
	cfg := jaegercfg.Configuration{
		ServiceName: "client test", // The name of the service making the request in the call chain
		Sampler: &jaegercfg.SamplerConfig{
			Type:  jaeger.SamplerTypeConst,
			Param: 1,
		},
		Reporter: &jaegercfg.ReporterConfig{
			LogSpans: true,
		},
	}
The Sampler is a client sampling rate configuration, and you can select the sampling type via the sampler.type and sampler.param attributes, which we'll discuss in detail later.
The Reporter can be configured for how to report data, which we'll discuss in a separate section.
When passing context, we can print some logs:
jLogger := jaegerlog.StdLogger
Once configured, we can create the tracer object:
	tracer, closer, err := cfg.NewTracer(
		jaegercfg.Logger(jLogger),
	)

	defer closer.Close()
	if err != nil {
	}
The complete code is as follows:
import (
    "github.com/opentracing/opentracing-go"
	"github.com/uber/jaeger-client-go"
	jaegercfg "github.com/uber/jaeger-client-go/config"
	jaegerlog "github.com/uber/jaeger-client-go/log"
)

func main() {

	cfg := jaegercfg.Configuration{
		ServiceName: "client test", // The name of the service making the request in the call chain
		Sampler: &jaegercfg.SamplerConfig{
			Type:  jaeger.SamplerTypeConst,
			Param: 1,
		},
		Reporter: &jaegercfg.ReporterConfig{
			LogSpans: true,
		},
	}

	jLogger := jaegerlog.StdLogger
	tracer, closer, err := cfg.NewTracer(
		jaegercfg.Logger(jLogger),
	)

	defer closer.Close()
	if err != nil {
	}

	// Create the first span A
	parentSpan := tracer.StartSpan("A")
	defer parentSpan.Finish()

	B(tracer, parentSpan)
}

func B(tracer opentracing.Tracer, parentSpan opentracing.Span) {
	// Inherit context and create a child span
	childSpan := tracer.StartSpan(
		"B",
		opentracing.ChildOf(parentSpan.Context()),
	)
	defer childSpan.Finish()
}
Upon starting the application, you will see logs like:
2021/03/30 11:14:38 Initializing logging reporter
2021/03/30 11:14:38 Reporting span 689df7e83255d05d:75668e8ed5ec61da:689df7e83255d05d:1
2021/03/30 11:14:38 Reporting span 689df7e83255d05d:689df7e83255d05d:0000000000000000:1
2021/03/30 11:14:38 DEBUG: closing tracer
2021/03/30 11:14:38 DEBUG: closing reporter
Sampler Configuration
Here’s an example of the sampler configuration code:
		Sampler: &jaegercfg.SamplerConfig{
			Type:  jaeger.SamplerTypeConst,
			Param: 1,
		}
This sampler can use jaegercfg.SamplerConfig, and you can configure the sampler using the type and param fields.
Why configure a sampler? Because there are countless requests in services, if every request needs to record tracing information and send it to the Jaeger backend, the performance consumed by logging trace and pushing trace information in high concurrency scenarios cannot be ignored and can significantly impact the system. After configuring the sampler, Jaeger will make sampling decisions based on the currently configured sampling strategy.
For details, refer to: https://www.jaegertracing.io/docs/1.22/sampling/
The Param field in the jaegercfg.SamplerConfig structure sets the sampling rate or speed depending on Type.
Here’s a relationship explanation:
| Type | Param | Description |
| --------------- | ------- | --------------------------------------------------------------- |
| "const" | 0 or 1 | The sampler always makes the same decision for all tracers; either all are sampled or none are sampled |
| "probabilistic" | 0.0~1.0 | The sampler makes random sampling decisions, with Param representing the sampling probability |
| "ratelimiting" | N | The sampler samples the tracers at a constant rate; for example, Param=2.0, which limits the collection to 2 spans per second |
| "remote" | None | The sampler queries the Jaeger agent for the appropriate sampling strategy to use within the current service. |
The default value for sampler.Type="remote"/sampler.Type=jaeger.SamplerTypeRemote is when we do not make configurations. It allows dynamically controlling the sampling strategy within the service from central configurations at the Jaeger backend.
Reporter Configuration
Let’s look at the definition of ReporterConfig.
type ReporterConfig struct {
    QueueSize                  int `yaml:"queueSize"`
    BufferFlushInterval        time.Duration
    LogSpans                   bool   `yaml:"logSpans"`
    LocalAgentHostPort         string `yaml:"localAgentHostPort"`
    DisableAttemptReconnecting bool   `yaml:"disableAttemptReconnecting"`
    AttemptReconnectInterval    time.Duration
    CollectorEndpoint          string            `yaml:"collectorEndpoint"`
    User                       string            `yaml:"user"`
    Password                   string            `yaml:"password"`
    HTTPHeaders                map[string]string `yaml:"http_headers"`
}
The Reporter configuration determines how the client reports tracing information; all fields are optional.
Here are a few commonly used configuration fields:
-
QUEUESIZE: Sets the queue size for storing sampled span information. Once the queue is full, it sends data in bulk to the Jaeger backend; the default queue size is 100.
-
BufferFlushInterval: Forces flushing and pushing the queue over time. For applications with low traffic, the queue may not fill up for a long time, so setting this time ensures that data is pushed automatically after timeout. For high concurrency scenarios, the queue generally fills up quickly and will push automatically upon being full.
-
LogSpans: Determines whether to push logs as well; spans can carry some logging information.
-
LocalAgentHostPort: The Jaeger agent to push data to, with the default port being 6831, which is the port for receiving data in compressed thrift format.
-
CollectorEndpoint: The Jaeger Collector to push data to; if using Collector, there is no need for an agent.
For example, to upload traces via HTTP:
		Reporter: &jaegercfg.ReporterConfig{
			LogSpans:           true,
			CollectorEndpoint: "http://127.0.0.1:14268/api/traces",
		},
According to insights from expert Heikong, HTTP uses thrift while gRPC is .NET specific, so there is only one reporter format, and we should ensure we fill in complete information for CollectorEndpoint.
。
Complete code testing:
import (
	"bufio"
    "github.com/opentracing/opentracing-go"
	"github.com/uber/jaeger-client-go"
	jaegercfg "github.com/uber/jaeger-client-go/config"
	jaegerlog "github.com/uber/jaeger-client-go/log"
	"os"
)

func main() {

	var cfg = jaegercfg.Configuration{
		ServiceName: "client test", // The name of the service initiating the call chain
		Sampler: &jaegercfg.SamplerConfig{
			Type:  jaeger.SamplerTypeConst,
			Param: 1,
		},
		Reporter: &jaegercfg.ReporterConfig{
			LogSpans:           true,
			CollectorEndpoint: "http://127.0.0.1:14268/api/traces",
		},
	}

	jLogger := jaegerlog.StdLogger
	tracer, closer, _ := cfg.NewTracer(
		jaegercfg.Logger(jLogger),
	)

	// Create the first span A
	parentSpan := tracer.StartSpan("A")
	// Call other services
	B(tracer, parentSpan)
	// Finish A
	parentSpan.Finish()
	// Close the current tracer
	closer.Close()

	reader := bufio.NewReader(os.Stdin)
	_, _ = reader.ReadByte()
}

func B(tracer opentracing.Tracer, parentSpan opentracing.Span) {
	// Inherit context and create child span
	childSpan := tracer.StartSpan(
		"B",
		opentracing.ChildOf(parentSpan.Context()),
	)
	defer childSpan.Finish()
}
Output after running:
2021/03/30 15:04:15 Initializing logging reporter
2021/03/30 15:04:15 Reporting span 715e0af47c7d9acb:7dc9a6b568951e4f:715e0af47c7d9acb:1
2021/03/30 15:04:15 Reporting span 715e0af47c7d9acb:715e0af47c7d9acb:0000000000000000:1
2021/03/30 15:04:15 DEBUG: closing tracer
2021/03/30 15:04:15 DEBUG: closing reporter
2021/03/30 15:04:15 DEBUG: flushed 1 spans
2021/03/30 15:04:15 DEBUG: flushed 1 spans
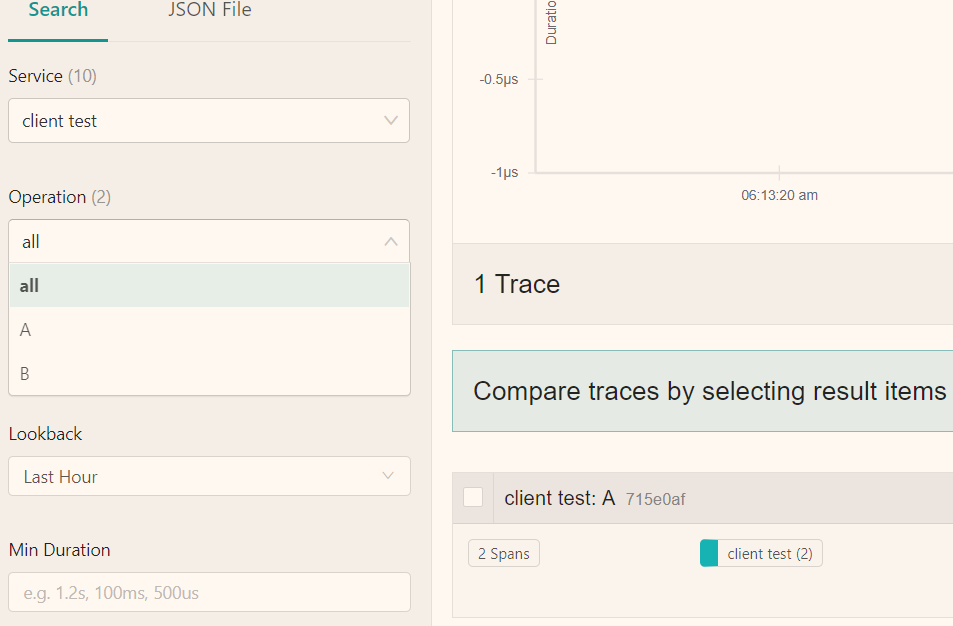
Open Jaeger UI, and you can see that it has been pushed successfully (http://127.0.0.1:16686).
At this point, we can abstract the code example:
func CreateTracer(serviceName string) (opentracing.Tracer, io.Closer, error) {
	var cfg = jaegercfg.Configuration{
		ServiceName: serviceName,
		Sampler: &jaegercfg.SamplerConfig{
			Type:  jaeger.SamplerTypeConst,
			Param: 1,
		},
		Reporter: &jaegercfg.ReporterConfig{
			LogSpans:          true,
			// Replace with your actual IP
			CollectorEndpoint: "http://127.0.0.1:14268/api/traces",
		},
	}

	jLogger := jaegerlog.StdLogger
	tracer, closer, err := cfg.NewTracer(
		jaegercfg.Logger(jLogger),
	)
	return tracer, closer, err
}
This allows for code reuse by calling the function to create a new tracer. Remember this for later use.
Distributed Systems and Span
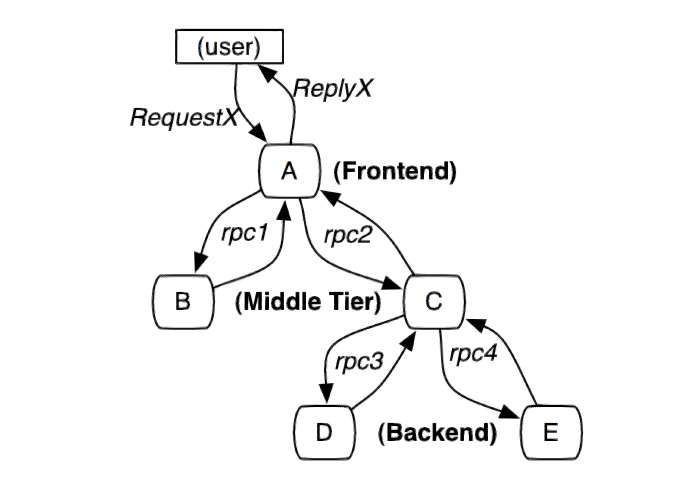
The previous sections discussed how to configure the tracer and push data to the Jaeger Collector. Next, let's talk about Span. Refer to the image below.
The diagram below illustrates a distributed system initiated by a request from user X, passing through multiple services, where A, B, C, D, and E represent different subsystems or processing stages.
In this diagram, A is the front end, B and C are the middle layers, while D and E are the back end of C. These subsystems are connected via RPC protocols, such as gRPC.
The implementation of a simple and practical distributed tracing system involves collecting tracking identifiers (message identifiers) and timestamps (timestamped events) for every request and response on the server.
Here, we need to remember that starting from A, it needs to rely on multiple services to complete a task, and each service could be a process or another function within a process. It depends on how your code is written. We will discuss how to define these relationships in detail later; for now, just get a general idea.
How to Invoke and Pass
If you have understood Jaeger or read the Basic Implementation Principles of Distributed Tracing Framework, then you should have a general understanding of how Jaeger works.
Jaeger is a distributed tracing tool, and without cross-process usage, its significance is lost. In microservices, cross-process calls typically involve HTTP and gRPC. Next, we will explain how to pass Jaeger context in HTTP and gRPC calls.
HTTP, Cross-Process Tracing
When process A calls process B via HTTP, it carries trace information (known as context) through the HTTP Header. Then, upon receiving this, the B process parses the information and associates it with the new trace being created.
Generally, middleware is used to handle the context received from other processes. The inject function packages the context into the header, while the extract function parses it out.
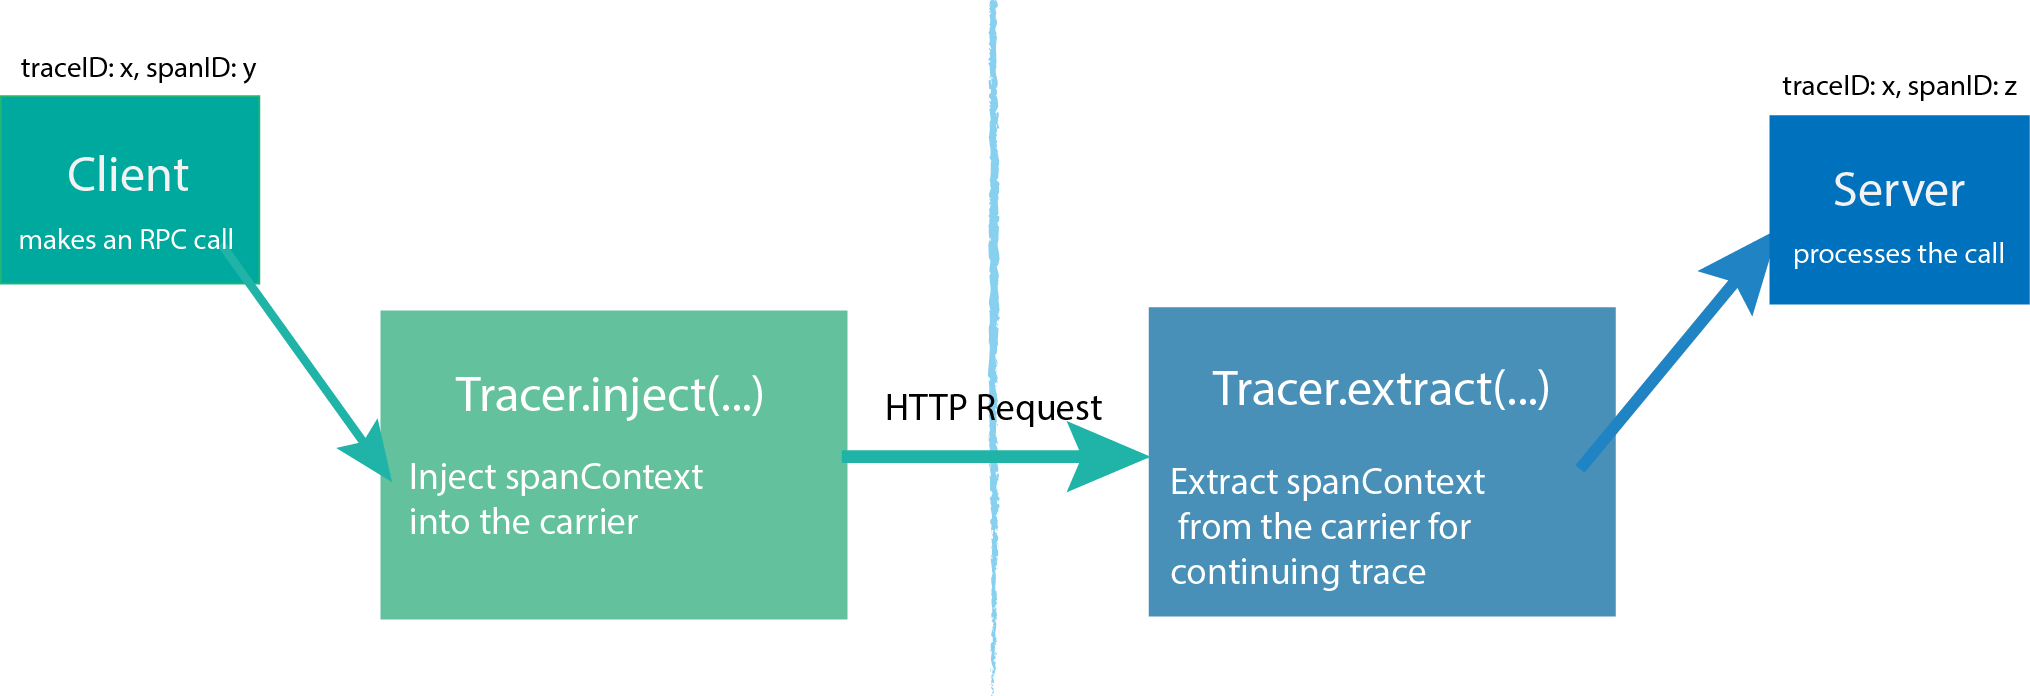
Here, we can break it down into two steps. The first step is passing context information from process A to process B. To simplify demonstration and practice, we will adopt a client-webserver approach and write code.
Client
In process A, create a new method:
// Request remote service to obtain user information
func GetUserInfo(tracer opentracing.Tracer, parentSpan opentracing.Span) {
	// Inherit context and create child span
	childSpan := tracer.StartSpan(
		"B",
		opentracing.ChildOf(parentSpan.Context()),
	)

	url := "http://127.0.0.1:8081/Get?username=痴者工良"
	req, _ := http.NewRequest("GET", url, nil)
	// Set tag, which we will discuss later
	ext.SpanKindRPCClient.Set(childSpan)
	ext.HTTPUrl.Set(childSpan, url)
	ext.HTTPMethod.Set(childSpan, "GET")
	tracer.Inject(childSpan.Context(), opentracing.HTTPHeaders, opentracing.HTTPHeadersCarrier(req.Header))
	resp, _ := http.DefaultClient.Do(req)
	_ = resp 	// Discard
	defer childSpan.Finish()
}
Then reuse the CreateTracer function mentioned earlier.
Modify the main function:
func main() {
	tracer, closer, _ := CreateTracer("UserinfoService")
	// Create the first span A
	parentSpan := tracer.StartSpan("A")
	// Call other services
	GetUserInfo(tracer, parentSpan)
	// Finish A
	parentSpan.Finish()
	// Close the current tracer
	closer.Close()

	reader := bufio.NewReader(os.Stdin)
	_, _ = reader.ReadByte()
}
For the complete code, please refer to: https://github.com/whuanle/DistributedTracingGo/issues/1
Web Server
For the server side, we will use gin to set up.
Create a new Go project and execute go get -u github.com/gin-gonic/gin in the main.go directory.
Create a function that creates a tracer and inherits the context information passed from other processes.
// Parse from context and create a new trace to obtain the propagated context (SpanContext)
func CreateTracer(serviceName string, header http.Header) (opentracing.Tracer, opentracing.SpanContext, io.Closer, error) {
	var cfg = jaegercfg.Configuration{
		ServiceName: serviceName,
		Sampler: &jaegercfg.SamplerConfig{
			Type:  jaeger.SamplerTypeConst,
			Param: 1,
		},
		Reporter: &jaegercfg.ReporterConfig{
			LogSpans: true,
			// Replace with your actual IP
			CollectorEndpoint: "http://127.0.0.1:14268/api/traces",
		},
	}

	jLogger := jaegerlog.StdLogger
	tracer, closer, err := cfg.NewTracer(
		jaegercfg.Logger(jLogger),
	)
	// Inherit the context passed from other processes
	spanContext, _ := tracer.Extract(opentracing.HTTPHeaders,
		opentracing.HTTPHeadersCarrier(header))
	return tracer, spanContext, closer, err
}
To parse the span context passed via HTTP, we need to handle some details through middleware.
func UseOpenTracing() gin.HandlerFunc {
	handler := func(c *gin.Context) {
		// Use opentracing.GlobalTracer() to obtain the global Tracer
		tracer, spanContext, closer, _ := CreateTracer("userInfoWebService", c.Request.Header)
		defer closer.Close()
		// Generate dependency relationships and create a span,
		// This is important because it generates References []SpanReference dependencies
		startSpan := tracer.StartSpan(c.Request.URL.Path, ext.RPCServerOption(spanContext))
		defer startSpan.Finish()

		// Record tags
		// Record the request URL
		ext.HTTPUrl.Set(startSpan, c.Request.URL.Path)
		// HTTP Method
		ext.HTTPMethod.Set(startSpan, c.Request.Method)
		// Record component name
		ext.Component.Set(startSpan, "Gin-Http")

		// Attach the current process's context information to the header
		c.Request = c.Request.WithContext(opentracing.ContextWithSpan(c.Request.Context(), startSpan))
		// Pass to the next middleware
		c.Next()
		// Continue to set tags
		ext.HTTPStatusCode.Set(startSpan, uint16(c.Writer.Status()))
	}

	return handler
}
Don't forget the API service:
func GetUserInfo(ctx *gin.Context) {
	userName := ctx.Param("username")
	fmt.Println("Received request, username is:", userName)
	ctx.String(http.StatusOK, "His blog is https://whuanle.cn")
}
Then, the main function:
func main() {
	r := gin.Default()
	// Insert middleware processing
	r.Use(UseOpenTracing())
	r.GET("/Get", GetUserInfo)
	r.Run("0.0.0.0:8081") // listen and serve on 0.0.0.0:8080 (for windows "localhost:8080")
}
For the complete code, please refer to: https://github.com/whuanle/DistributedTracingGo/issues/2
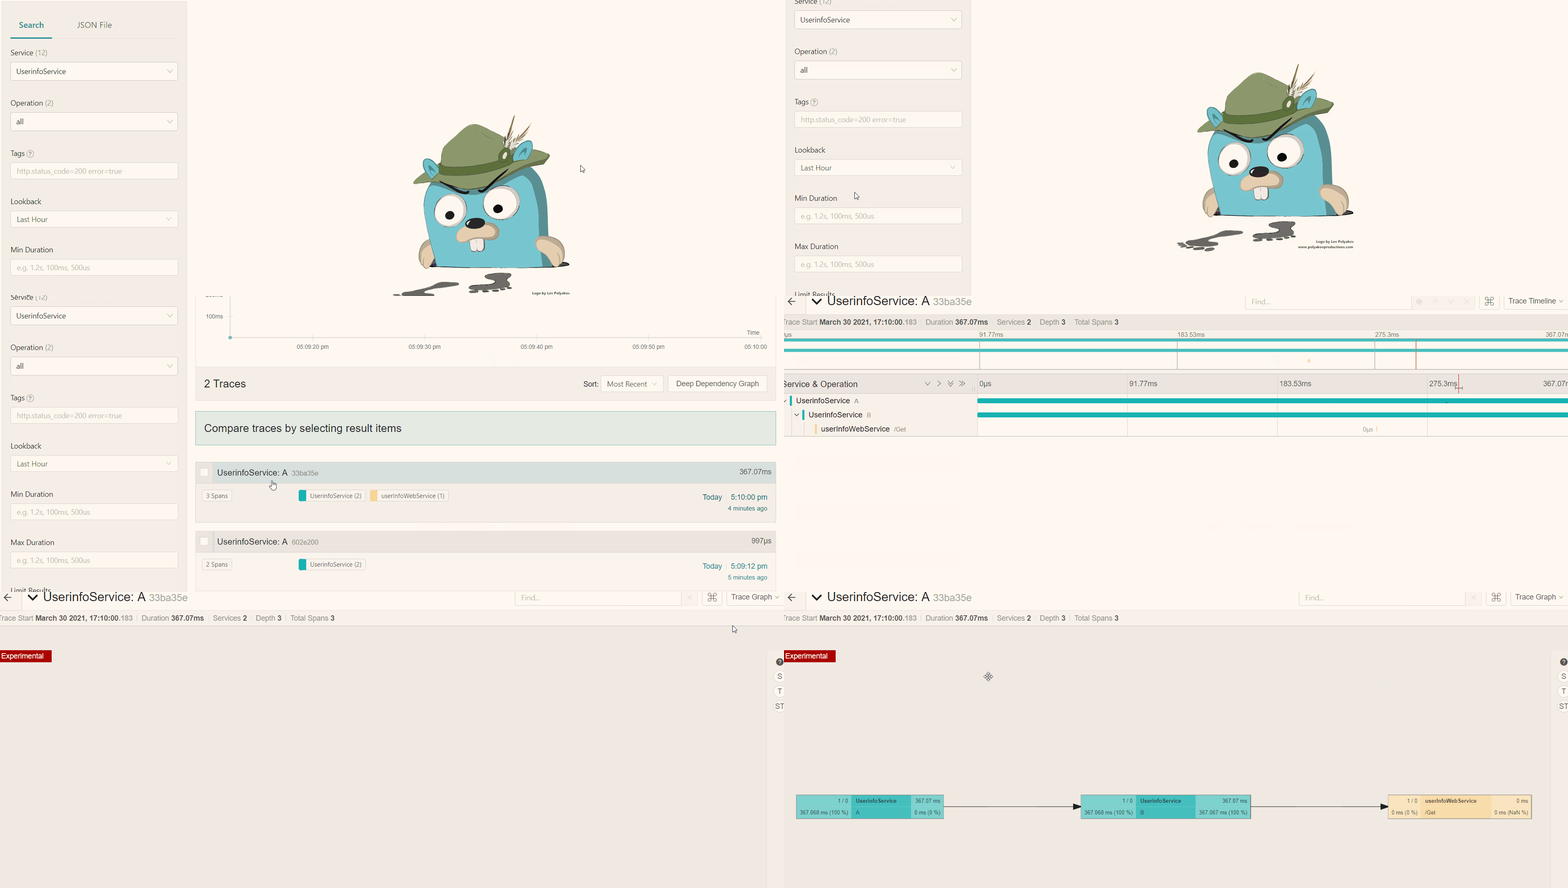
Start both the web server and client, and you will see printed logs. Additionally, opening the Jaeger UI will display the relevant tracing information.
Tags, Logs, and References
In Jaeger's tracing, tags and logs can both be carried as key-value pairs:
                        {
                            "key": "http.method",
                            "type": "string",
                            "value": "GET"
                        },
Tags are set using the ext.xxxx format, for example:
ext.HTTPUrl.Set(startSpan, c.Request.URL.Path)
Since opentracing has already defined all tag types, we only need to call ext.xxx.Set() to set them.
I forgot to add logs when writing the example earlier... Logging is actually quite simple; you can set it by calling functions on the span object.
Example (add it inside the middleware):
        startSpan.LogFields(
            log.String("event", "soft error"),
            log.String("type", "cache timeout"),
            log.Int("waited.millis", 1500))

References indicate the relationships between multiple spans. A span can exist across processes or as different functions within a single process.
The dependencies of spans are depicted in the example:
                    "references": [
                        {
                            "refType": "CHILD_OF",
                            "traceID": "33ba35e7cc40172c",
                            "spanID": "1c7826fa185d1107"
                        }]
Here, spanID refers to its parent span.
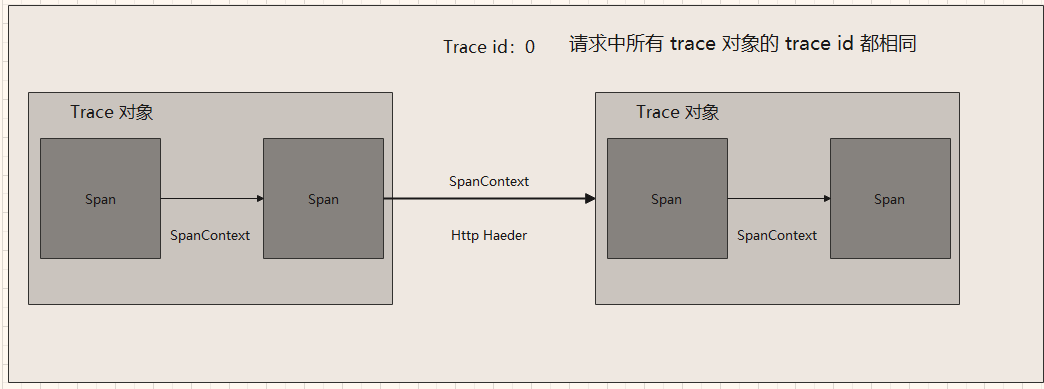
You can refer to the illustration below.
A tracer within a process can wrap some code and operations, generating information for multiple spans or creating parent-child relationships.
On the other hand, the SpanContext passed in remote requests is transferred, allowing the remote service to also create a new tracer, which in turn generates span dependencies from the SpanContext.
In the child span, its reference list will include the parent span's span ID.
The article on the Jaeger Client for Go concludes here. I haven't been using Go for long, so feel free to share insights with each other!

文章评论