Introduction
CZGL.ProcessMetrics is a metrics library that records information about the program's GC (Garbage Collection), CPU, memory, machine network, disk space, etc. It uses Prometheus to collect this information and then displays it using Grafana.
Video link:
https://www.bilibili.com/video/BV18y4y1K7Ax/
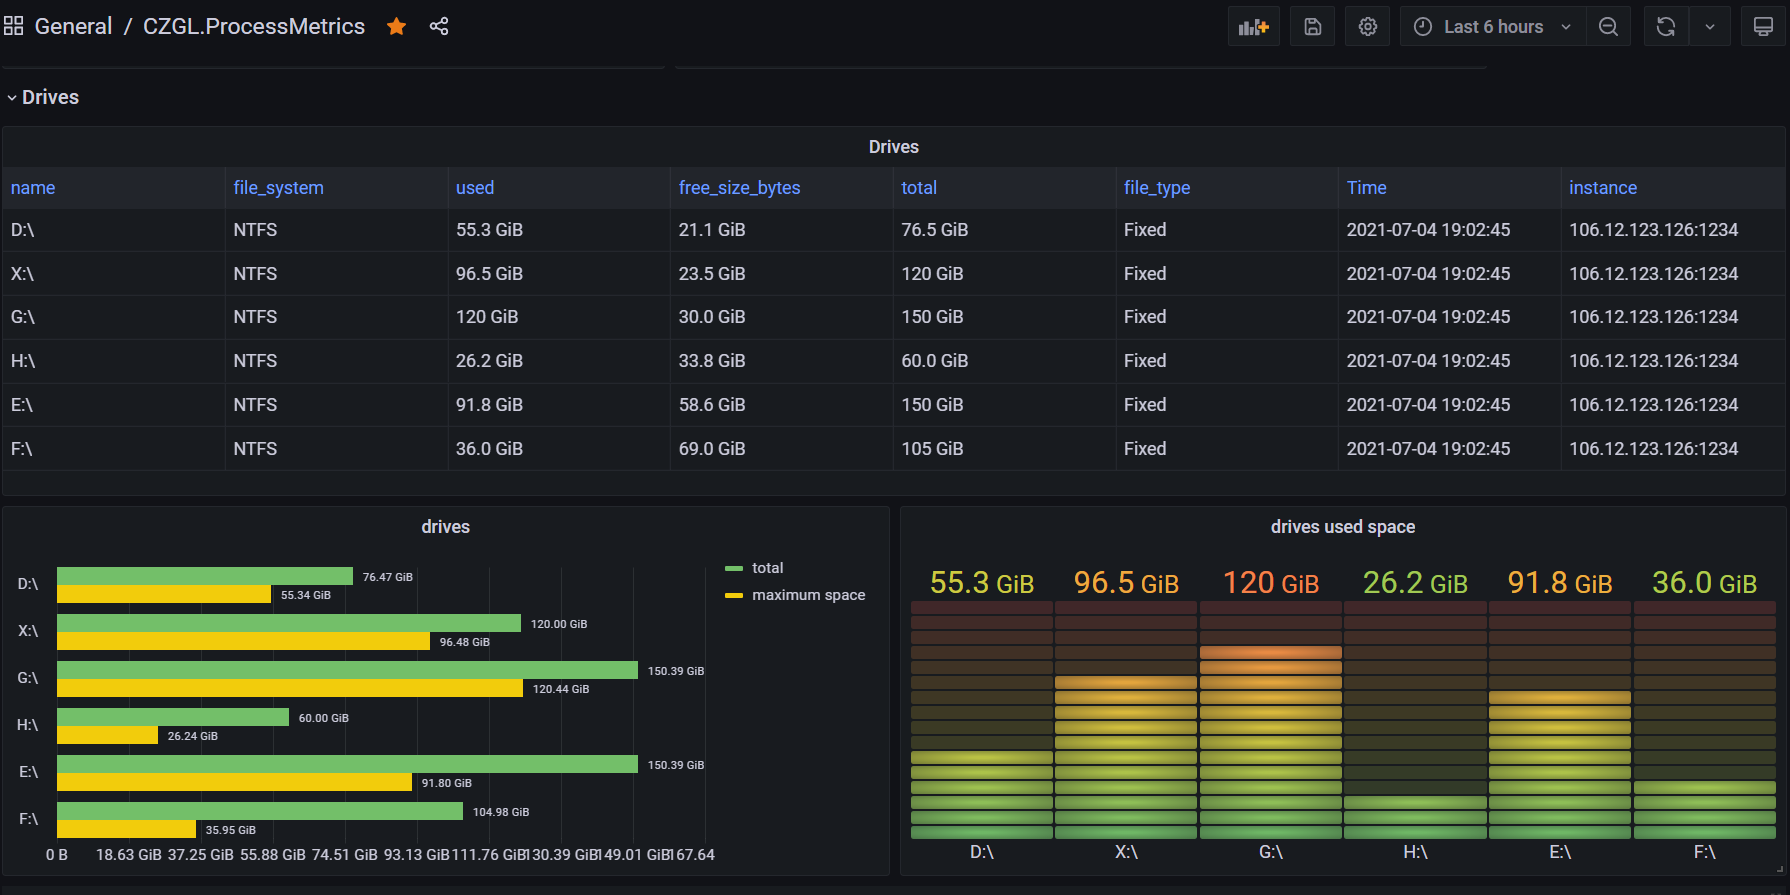
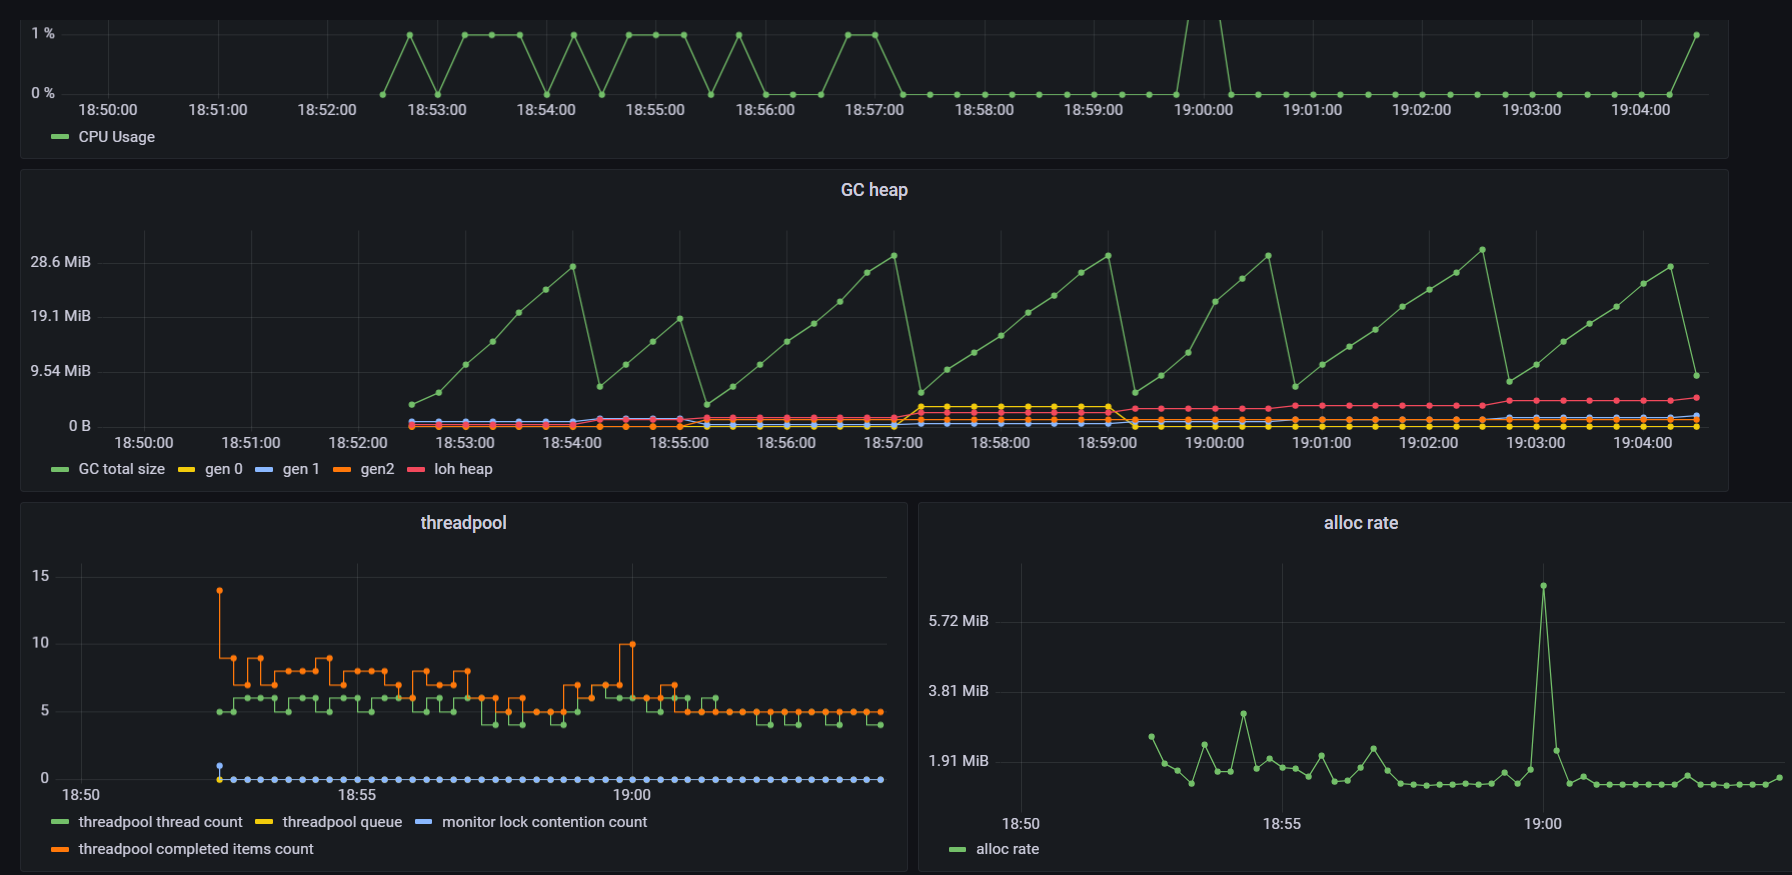
Preview of effect:
Installing ProcessMetrics
You can quickly add resource monitoring to your program by simply installing a library via Nuget.
Create a new ASP.NET Core application, search for CZGL.ProcessMetrics in Nuget and reference it directly.
Nuget link: https://www.nuget.org/packages/CZGL.ProcessMetrics
Then, in the middleware, add the access service for ProcessMetrics.
            app.UseEndpoints(endpoints =>
            {
                endpoints.MapControllers();
                endpoints.ProcessMetrices("/metrics");
            });
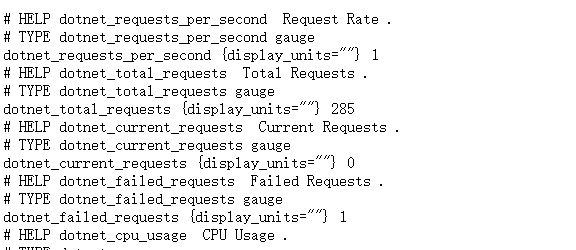
Access the corresponding URL, and you will see a lot of information output, which is in the format of Prometheus data.
http://127.0.0.1:1234/metrics
Setting Up Prometheus/Grafana
Here, we use Docker to set up the monitoring platform.
Pull the images:
docker pull prom/prometheus
docker pull grafana/grafana
In the /opt/prometheus directory, create a prometheus.yml file with the following content:
# my global config
global:
  scrape_interval:     15s # Set the scrape interval to every 15 seconds. Default is every 1 minute.
  evaluation_interval: 15s # Evaluate rules every 15 seconds. The default is every 1 minute.
  # scrape_timeout is set to the global default (10s).

# Alertmanager configuration
alerting:
  alertmanagers:
  - static_configs:
    - targets:
      # - alertmanager:9093

# Load rules once and periodically evaluate them according to the global 'evaluation_interval'.
rule_files:
  # - "first_rules.yml"
  # - "second_rules.yml"

# A scrape configuration containing exactly one endpoint to scrape:
# Here it's Prometheus itself.
scrape_configs:
  # The job name is added as a label 'job=<job_name>' to any timeseries scraped from this config.
  - job_name: 'prometheus'

    # metrics_path defaults to '/metrics'
    # scheme defaults to 'http'.

    static_configs:
    - targets: ['localhost:9090']


  - job_name: 'processmetrice'
    metrics_path: '/metrics'
    static_configs:
    - targets: ['123.123.123.123:1234']
Please replace the last line's IP address.
Start Prometheus using a container:
docker run -d -p 9090:9090 -v /opt/prometheus/prometheus.yml:/etc/prometheus/prometheus.yml prom/prometheus
Start Grafana using a container:
mkdir /opt/grafana-storage
chmod 777 -R /opt/grafana-storage
docker run -d   -p 3000:3000   --name=grafana   -v /opt/grafana-storage:/var/lib/grafana   grafana/grafana
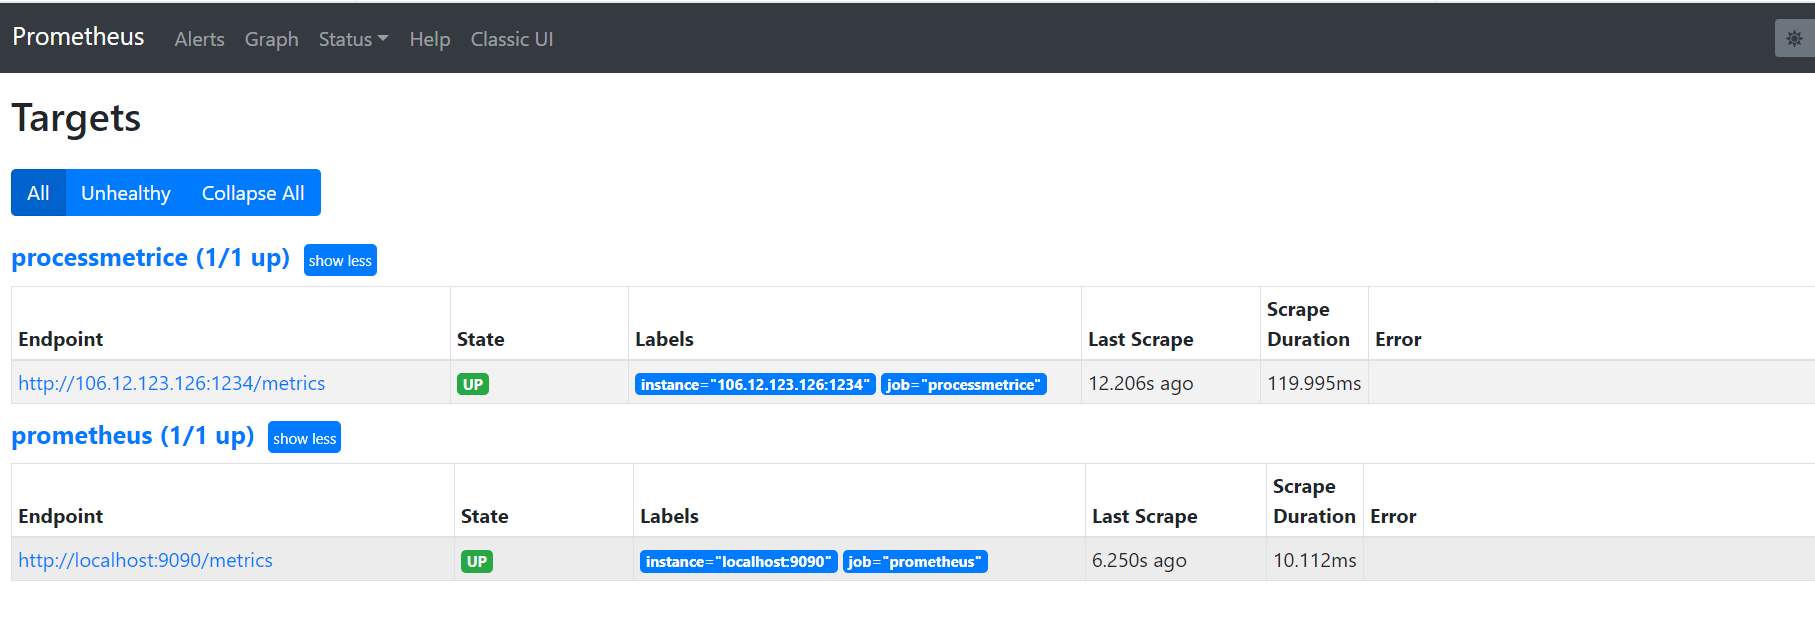
Open port 9090, and in the menu bar click on Status-Targets to see relevant records.
Next, access port 3000 to open Grafana. The initial username and password are both admin.
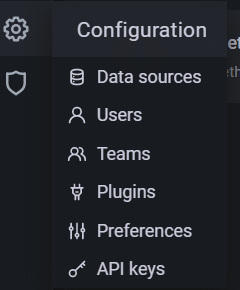
Configuring Grafana
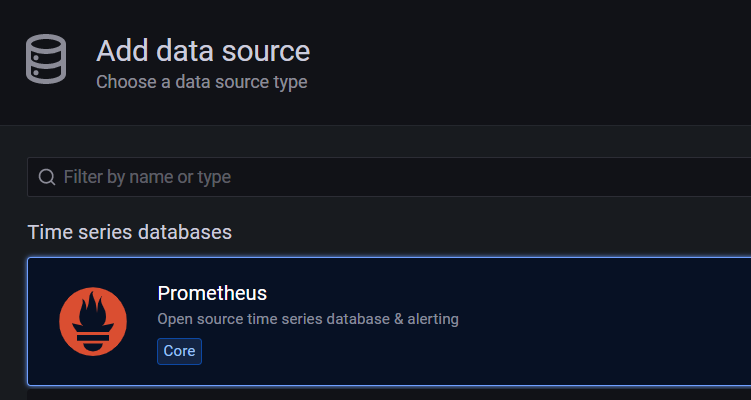
First, we need to obtain monitoring data from Prometheus for Grafana. We must add a data source.
Select Prometheus, and fill in the HTTP-URL as prompted.
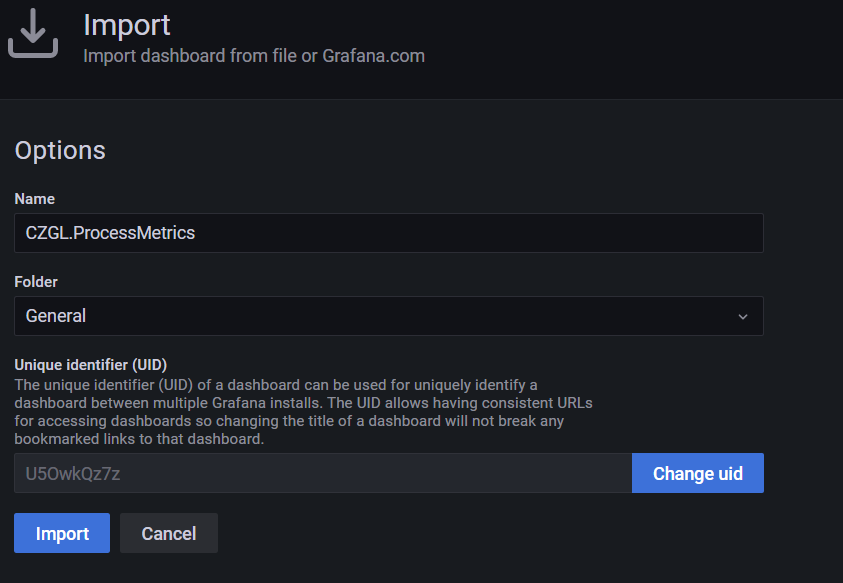
Next, download the customized JSON model from the author, named CZGL.ProcessMetrics.json.
Download link:
https://github.com/whuanle/CZGL.SystemInfo/releases/tag/v1.0
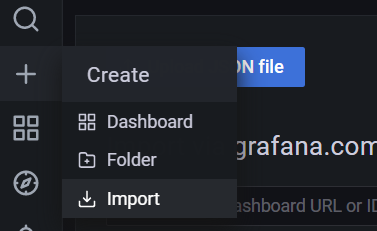
Then import the model file.
You will then see the monitoring interface.

文章评论