Introduction
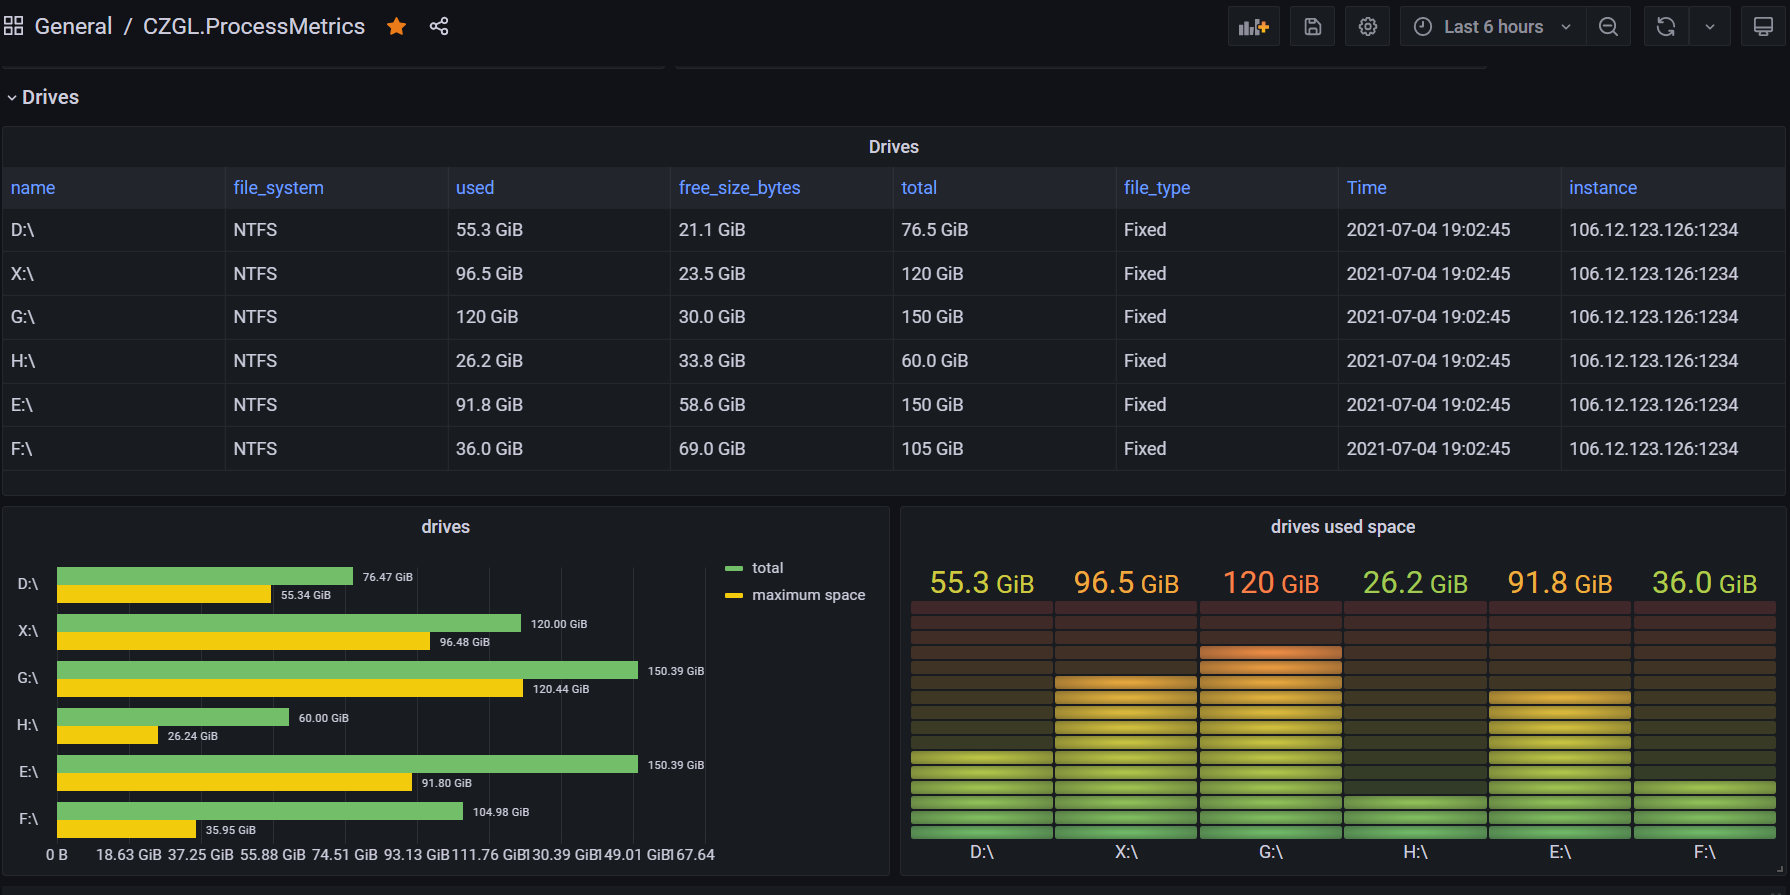
CZGL.ProcessMetrics is a metrics library that records information such as GC, CPU, memory, machine network, and disk space of applications, utilizes Prometheus for data collection, and displays it using Grafana.
I spent Sunday updating this library, fixing some bugs, and adding some interesting features. It supports multiple servers and applications, and works with WPF, WinForms, .NET Core, etc. It can push monitoring data to Prometheus without exposing ports, and supports custom data sources.
Additionally, some optimizations were made to the Grafana template, and new data sources were added.
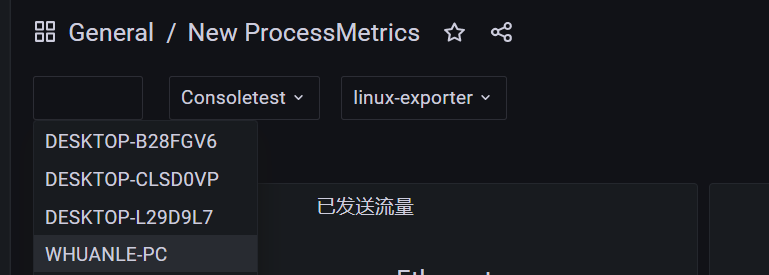
Select the data to be displayed based on machine, application, etc.:
Three Ways to Handle Monitoring Data
For detailed documentation, please refer to:
https://github.com/whuanle/CZGL.SystemInfo/blob/primary/docs/Metrics.md
Active Push
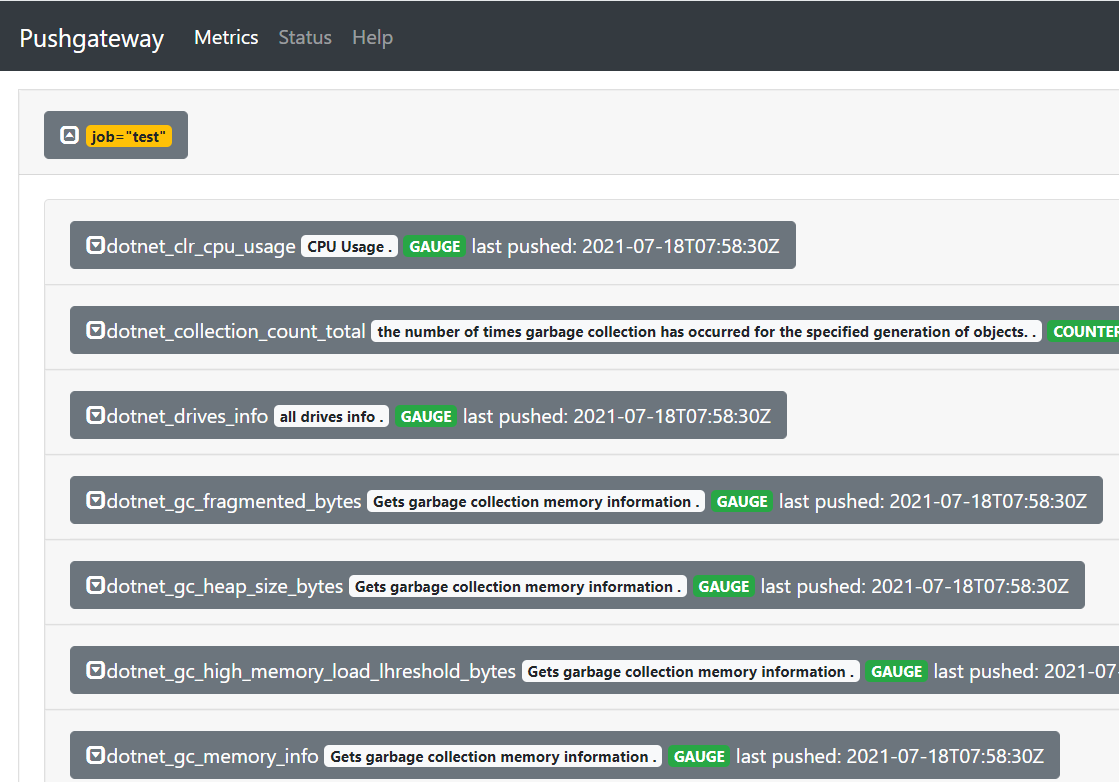
The first method uses Pushgateway, which allows any client to push custom monitoring metrics that conform to specifications, and Prometheus then collects the monitoring data uniformly.
Instead of pushing all application monitoring data directly to Prometheus, you can push it to Pushgateway, enabling multiple applications to push data together, after which Prometheus retrieves it periodically in bulk.
Sample code:
            MetricsPush metricsPush = new MetricsPush("http://123.12.1.2:9091");
            while (true)
            {
                var code = metricsPush.PushAsync().Result;
                // If code is not 200, check if the push address is incorrect or contact the author for discussion
                // Custom push interval time
                Thread.Sleep(1000);
            }
This method is suitable for non-Web applications, applications that cannot expose ports, intranet applications, or applications like WinForms and WPF.
ASP.NET Core
In NuGet, search for the CZGL.ProcessMetrics.ASPNETCore package, then use middleware to generate the Metrics endpoint.
endpoints.ProcessMetrices("/metrics", options =>
{
// Monitor events in CLR
options.ListenerNames.Add(EventNames.System_Runtime);
// options.Labels.Add("other", "custom identifier");

// Custom data sources to monitor
options.Assemblies.Add(typeof(CZGL.ProcessMetrics.MetricsPush).Assembly);
});
Or:
endpoints.ProcessMetrices("/metrics");
Custom URL
Create a custom HTTP Server that exposes a URL for Prometheus to scrape.
new Thread(() =>
{
MetricsServer metricsServer = new MetricsServer("http://*:1234/metrics/");
metricsServer.Start();
}).Start();
.NET diagnostics
Have you ever used .NET tools to diagnose issues like memory leaks or high CPU usage? For example, dotnet-counter or dotnet-dump.
These tools can provide detailed EvenSource information:
[System.Runtime]
    % Time in GC since last GC (%)                         0
    Allocation Rate / 1 sec (B)                            0
    CPU Usage (%)                                          0
    Exception Count / 1 sec                                0
    GC Heap Size (MB)                                      4
    Gen 0 GC Count / 60 sec                                0
    Gen 0 Size (B)                                         0
    Gen 1 GC Count / 60 sec                                0
    Gen 1 Size (B)                                         0
    Gen 2 GC Count / 60 sec                                0
    Gen 2 Size (B)                                         0
    LOH Size (B)                                           0
    Monitor Lock Contention Count / 1 sec                  0
    Number of Active Timers                                1
    Number of Assemblies Loaded                          140
    ThreadPool Completed Work Item Count / 1 sec           3
    ThreadPool Queue Length                                0
    ThreadPool Thread Count                                7
    Working Set (MB)                                      63
With CZGL.ProcessMetrics, you can monitor these metrics as well!
In .NET, there are built-in EventSources. Readers can refer to: https://docs.microsoft.com/en-us/dotnet/core/diagnostics/available-counters#microsoftaspnetcorehttpconnections-counters
Common EventSources include:
             * Microsoft-Windows-DotNETRuntime
             * System.Runtime
             * Microsoft-System-Net-Http
             * System.Diagnostics.Eventing.FrameworkEventSource
             * Microsoft-Diagnostics-DiagnosticSource
             * Microsoft-System-Net-Sockets
             * Microsoft-System-Net-NameResolution
             * System.Threading.Tasks.TplEventSource
             * System.Buffers.ArrayPoolEventSource
             * Microsoft-System-Net-Security
             * System.Collections.Concurrent.ConcurrentCollectionsEventSource
In CZGL.ProcessMetrics, only System.Runtime is monitored by default. You can add more EventSource types, even your custom EventSources.
During configuration, simply use:
endpoints.ProcessMetrices("/metrics", options =>
{
// Monitor events in CLR
options.ListenerNames.Add(EventNames.System_Runtime);
options.ListenerNames.Add(EventNames.AspNetCore_Http_Connections);
}
MetricsPush metricsPush = new MetricsPush(url: "http://123.1.1.2:9091",
option: options =>
{
// Monitor events in CLR
options.ListenerNames.Add(EventNames.System_Runtime);
options.ListenerNames.Add(EventNames.AspNetCore_Http_Connections);
});
Custom Monitoring Metrics
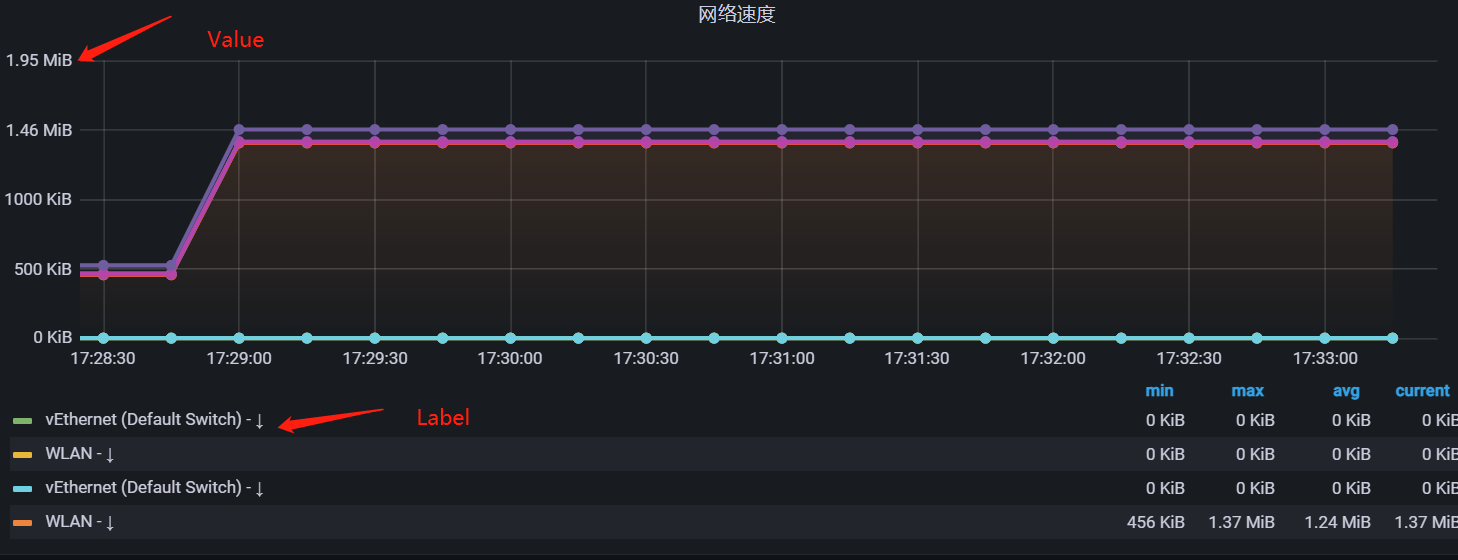
If you have some metric data that needs to be displayed on Grafana, such as user mouse clicks or concurrent request counts, you can easily add it:
    public class CLRMetrics : IMerticsSource
    {
        public async Task InvokeAsync(ProcessMetricsCore metricsCore)
        {
            await Task.Factory.StartNew(() =>
            {
                Gauge monitor = metricsCore.CreateGauge("metric_name", "metric_description");
                monitor.Create()
                .AddLabel("custom_label", value.ToString())
                .SetValue(Monitor.LockContentionCount);
            });
        }
    }
Custom data sources need to inherit the IMerticsSource interface.
Currently, it supports two forms of data: Counter and Gauge. Counter is an accumulator suitable for continuously increasing data, while Gauge is for free data.
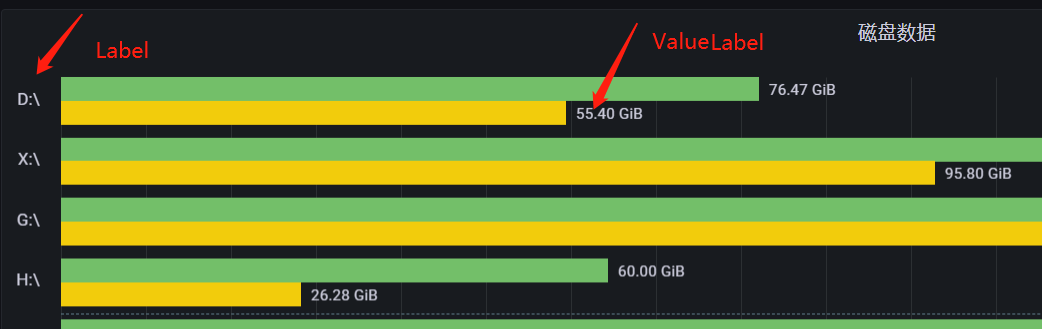
Custom identifiers are used to display specific information, and Value shows the actual value. Multiple Labels can be defined, but Value will appear only once. For example:
.AddLabel("disk_name","D:\")
.AddLabel("used_space","58091110")    // Unit Byte, i.e., 55.40 GB
.AddValue(0)                           // Sometimes we only need to display Label without Value, just fill in any number
This library is just a simple tool. Compared to professional metrics tools, it doesn't have many metric data; its advantage is its small size and ease of use... The library doesn't have complex features, and you can get it up and running with just a few lines of code, making it convenient for small applications to set up simple monitoring at little cost.
Please go easy on me.
For detailed documentation, please refer to:
https://github.com/whuanle/CZGL.SystemInfo/blob/primary/docs/Metrics.md
Project address:
https://github.com/whuanle/CZGL.SystemInfo
If you need to supplement .NET monitoring metrics or customize the Grafana interface, feel free to contact me for discussion!

文章评论