Kubernetes Monitoring
When your application is deployed to Kubernetes, it becomes challenging to see what is happening inside the containers. Once a container dies, the data inside it may be permanently lost, and you might not even be able to view the logs to pinpoint the issue. Moreover, an application may have many instances, and a user request does not specify which container will handle it. This complexity makes troubleshooting applications in Kubernetes more difficult. Outside of the applications, Kubernetes manages the lifecycle of the entire cluster as the underlying infrastructure; thus, any failure in Kubernetes will undoubtedly impact the operational services of applications. Therefore, monitoring the health of Kubernetes is also crucial.
When your applications are cloud-native, you must pay attention to the operational status of various servers, middleware, and the operational status of every component and resource object in Kubernetes, along with each application's operational state. Of course, this operational status is a vague concept that depends on our focus. The "operational state" expressed by each monitored object is different. To monitor the objects we care about, these objects need to cooperate by providing appropriate operational status information for us to collect and analyze, which can be referred to as observability.
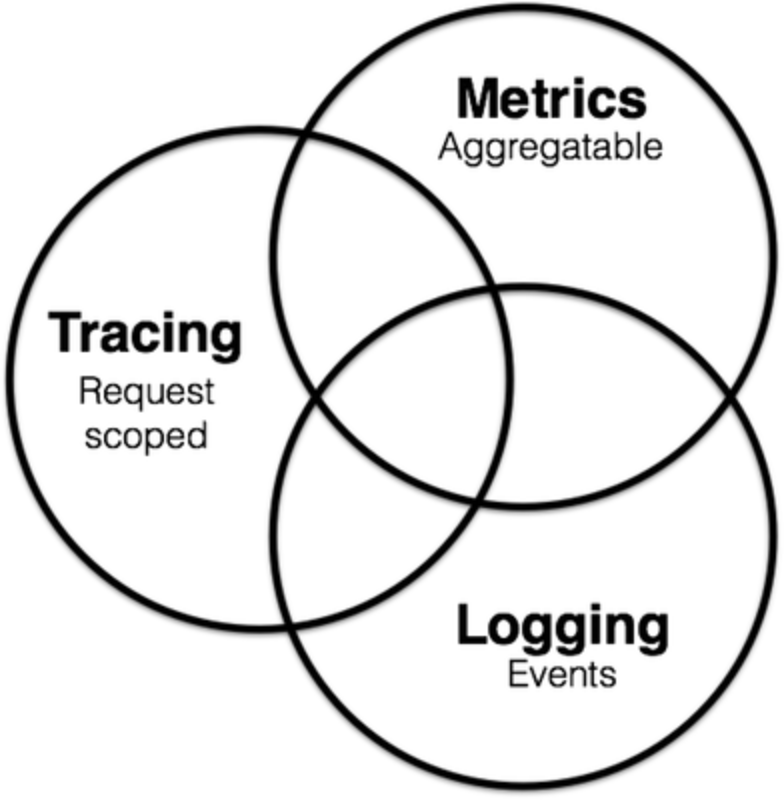
In cloud-native environments, observability is generally divided into three main scopes:
You can learn how to monitor, debug, and handle logs in the Kubernetes documentation:
https://v1-20.docs.kubernetes.io/docs/tasks/debug-application-cluster/
In this article, monitoring refers only to Metrics.
Metrics, Tracing, and Logging are not entirely independent. In the figure above, Metrics may also include information from Logging and Tracing.
Monitoring Targets
The monitoring data to be collected comes from the monitored objects, and in a Kubernetes cluster, we can categorize the objects we want to monitor into three major parts:
- Machines: All node machines in the cluster, with metrics such as CPU and memory usage, network and disk IO rates, etc.;
- Kubernetes Object Status: The statuses and some metrics information of objects like Deployments, Pods, DaemonSets, StatefulSets, etc.;
- Applications: The statuses or metrics of each container in the Pods, as well as the
/metricsendpoints that the containers may provide.
Prometheus
In a basic monitoring environment, a complete monitoring setup should include data collection, data storage, data analysis, data display, and alerting, among other components, each with relevant tools or technologies to solve the diverse needs and complexities in a cloud-native environment.
Since monitoring is necessary, monitoring tools are required. Monitoring tools can capture all important metrics and logs (Metrics may also encompass some logs) and store them in a secure, centralized location for easy access to devise solutions for issues. Because applications are deployed in a Kubernetes cluster, monitoring Kubernetes provides deep insights into the cluster's operational health and performance metrics, resource counts, and general internal conditions. When errors occur, monitoring tools will alert you (alerting functionality) to enable you to quickly implement fixes.
Prometheus is a CNCF project that natively monitors Kubernetes, nodes, and Prometheus itself. The current Kubernetes official documentation mainly recommends using Prometheus itself, as it provides out-of-the-box monitoring capabilities for the Kubernetes container orchestration platform. Therefore, the design of the monitoring solution in this article revolves around Prometheus.
Here are some components of Prometheus:
- Metric Collection: Prometheus fetches metrics using a pull model over HTTP. If Prometheus cannot retrieve the metrics, it can alternatively use a Pushgateway to push metrics to Prometheus.
- Metric Endpoint: Systems intended for monitoring with Prometheus should expose metrics at a specific
/metricsendpoint, which Prometheus scrapes at regular intervals. - PromQL: Prometheus comes with PromQL, a very flexible query language used to query metrics from the Prometheus dashboard. Additionally, Prometheus UI and Grafana will use PromQL queries to visualize metrics.
- Prometheus Exporters: There are many libraries and servers to help export existing metrics from third-party systems as Prometheus metrics. This is particularly useful for cases where direct usage of Prometheus metric detection for a given system is not possible.
- TSDB (Time-Series Database): Prometheus uses a TSDB to efficiently store all data. By default, all data is stored locally, but to avoid single points of failure, Prometheus TSDB can be optionally integrated with remote storage.
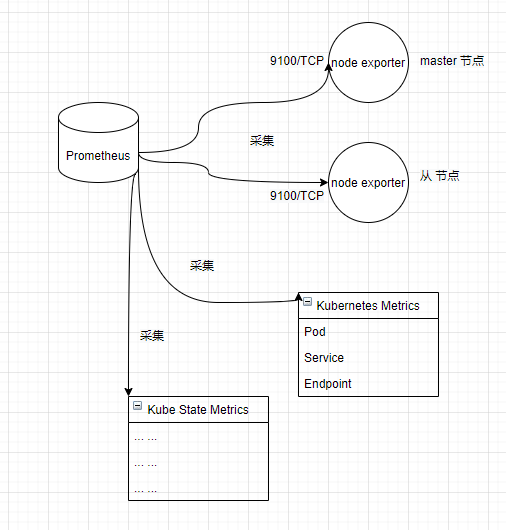
The monitoring architecture of Prometheus in Kubernetes is shown below:
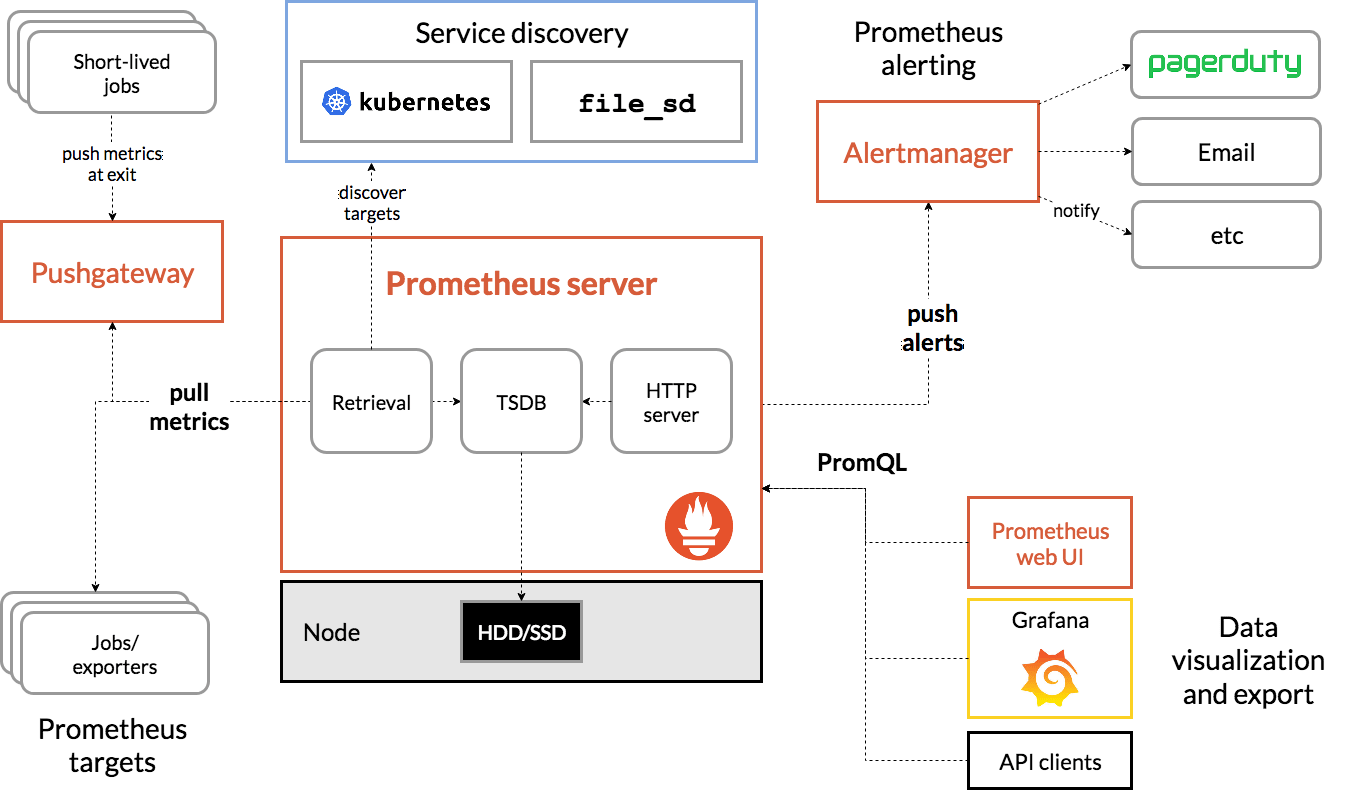
【Image Source: https://devopscube.com/setup-prometheus-monitoring-on-kubernetes/】
Metrics
There are many types of objects to monitor, and similar types of objects are referred to as an entity. The data generated by each entity during its operation has various forms. To categorize and collect this data, Prometheus divides the various attribute values in an entity into four types: Counter, Gauge, Histogram, and Summary. Each attribute within the entity is referred to as a metric; for example, cumulative CPU usage by a container is recorded with the metric name container_cpu_usage_seconds_total.
The general format of each metric is:
metric_name{metadata=value} metric_value
Each object generates data continuously. To distinguish which object's current metric value belongs to, you can attach a wealth of metadata information to the metric besides its value. An example is shown below.
container_cpu_usage_seconds_total{
	beta_kubernetes_io_arch = "amd64",
	beta_kubernetes_io_os = "linux",
	container = "POD",
	cpu = "total",
	id = "...",
	image = "k8s.gcr.io/pause:3.5",
	instance = "slave1",
	job = "kubernetes-cadvisor",
	kubernetes_io_arch = "amd64",
	kubernetes_io_hostname = "slave1",
	kubernetes_io_os = "linux",
	name = "k8s_POD_pvcpod_default_02ed547b-6279-4346-8918-551b87877e91_0",
	namespace = "default",
	pod = "pvcpod"
}
Once the object generates text in this structure, it can expose metrics endpoints for Prometheus to scrape automatically or be pushed to Prometheus via Pushgateway.
Next, we will build a complete Prometheus monitoring system in Kubernetes.
Practice
Node Monitoring
Reference for this chapter: https://devopscube.com/node-exporter-kubernetes/
Node exporter is written in Go and is used to collect all hardware and OS-level metrics exposed by the kernel on Linux systems, including CPU, memory, network traffic, system load, sockets, machine configuration, etc.
Readers can refer to the list of all default enabled or disabled metrics in https://github.com/prometheus/node_exporter.
Since we want to monitor every node in the cluster, we need to ensure that a node exporter instance runs on each node, and when new nodes are added to the cluster, a node exporter should automatically be scheduled to run on those nodes. Thus, the deployment of node exporter needs to use DaemonSet mode.
View all nodes in the cluster:
root@master:~# kubectl get nodes
NAME     STATUS                     ROLES                  AGE     VERSION
master   Ready,SchedulingDisabled   control-plane,master   98d     v1.22.2
slave2   Ready                      <none>                 3h50m   v1.23.3
slave1   Ready                      <none>                 98d     v1.22.2
Bibin Wilson has packaged up a YAML file for node exporter for Kubernetes, which we can directly download:
git clone https://github.com/bibinwilson/kubernetes-node-exporter
Open the daemonset.yaml file in the repository to understand the information contained within.
In the YAML file, you can see that the node exporter will be deployed in the monitoring namespace and has two labels:
   labels:
     app.kubernetes.io/component: exporter
     app.kubernetes.io/name: node-exporter
To allow the node exporter to be scheduled on the master node, we need to add toleration attributes to the Pod:
  template:
    metadata:
      labels:
        app.kubernetes.io/component: exporter
        app.kubernetes.io/name: node-exporter
    spec:
    # Copy the following section to the corresponding location
      tolerations:
      - key: "node-role.kubernetes.io/master"
        operator: "Exists"
        effect: "NoSchedule"
      - key: "node.kubernetes.io/unschedulable"
        operator: "Exists"
        effect: "NoSchedule"
To deploy the node exporter, we first create the namespace:
kubectl create namespace monitoring
Execute the command to deploy the node exporter:
kubectl create -f daemonset.yaml
Check node exporter instances
root@master:~# kubectl get daemonset -n monitoring
NAME            DESIRED   CURRENT   READY   UP-TO-DATE   AVAILABLE   NODE SELECTOR   AGE
node-exporter   3         3         3       3            3           <none>          22h
Since the node exporter Pods are distributed across various nodes, to facilitate Prometheus in collecting the IPs of these node exporter Pods, we need to create a Service to unify the collection of these Endpoints, so we create a Service to achieve this purpose.
Check the service.yaml file in the repository, which is defined as follows:
kind: Service
apiVersion: v1
metadata:
  name: node-exporter
  namespace: monitoring
  annotations:
      prometheus.io/scrape: 'true'
      prometheus.io/port:   '9100'
spec:
  selector:
      app.kubernetes.io/component: exporter
      app.kubernetes.io/name: node-exporter
  ports:
  - name: node-exporter
    protocol: TCP
    port: 9100
    targetPort: 9100
The selector for this Service is as follows:
selector:
   app.kubernetes.io/component: exporter
   app.kubernetes.io/name: node-exporter
Create the Service:
kubectl create -f service.yaml
Check the collected node exporter Pod IPs in the Endpoint:
root@master:~# kubectl get endpoints -n monitoring
NAME                    ENDPOINTS                                       AGE
node-exporter           10.32.0.27:9100,10.36.0.4:9100,10.44.0.3:9100   22h
The node exporter simply collects various metrics data and does nothing else.
Deploying Prometheus
Reference for this section: https://devopscube.com/setup-prometheus-monitoring-on-kubernetes/
Now that we have the node exporter to collect various metrics from the nodes, the next step is to collect metrics data from the Kubernetes infrastructure.
Kubernetes itself provides many metrics data through three major endpoints: /metrics/cadvisor, /metrics/resource, and /metrics/probes.
Using the /metrics/cadvisor endpoint as an example, cAdvisor analyzes the memory, CPU, file, and network usage metrics of all containers running on a given node. You can refer to https://github.com/google/cadvisor/blob/master/docs/storage/prometheus.md to understand all metrics collected by cAdvisor.
Additional resources:
Source code location: https://github.com/kubernetes/metrics/blob/master/pkg/apis/metrics/v1beta1/types.go
Kubernetes Monitoring Architecture Design: https://github.com/kubernetes/design-proposals-archive
In this section, the deployed Prometheus will take the following actions on Kubernetes to collect metrics data:
- Kubernetes APIServers: Obtain all metrics from the API server;
- Kubernetes Nodes: It collects all metrics from the Kubernetes nodes;
kubernetes-pods: Add annotationsprometheus.io/scrapeandprometheus.io/portto pod metadata, so all pod metrics will be discovered;kubernetes-cadvisor: Collect all cAdvisor metrics related to the containers;- Kubernetes Service Endpoints: If service metadata uses the
prometheus.io/scrapeannotation andprometheus.io/portannotation, all service endpoints will be removed from scraping.
Bibin Wilson has packaged the deployment definition files, which we can directly download:
git clone https://github.com/bibinwilson/kubernetes-prometheus
Prometheus uses the Kubernetes API Server to obtain metrics from all available nodes, Pods, Deployments, and so on. Therefore, we need to create an RBAC policy with only read access to the required API group and bind that policy to the monitoring namespace, limiting the Prometheus Pods to perform read operations only on the API.
Check the clusterRole.yaml file to see the list of resource objects it should monitor:
- apiGroups: [""]
  resources:
  - nodes
  - nodes/proxy
  - services
  - endpoints
  - pods
  verbs: ["get", "list", "watch"]
- apiGroups:
  - extensions
  resources:
  - ingresses
Create the role and role binding in the cluster:
kubectl create -f clusterRole.yaml
Prometheus can be configured through command-line flags and configuration files. While command-line flags set immutable system parameters (such as storage location and how much data to keep on disk and in memory), the configuration file defines all the scrape jobs and their instances as well as which rule files to load. Hence, file configuration is vital when deploying Prometheus.
The Prometheus configuration file is written in YAML format, and you can refer to the specifics here: https://prometheus.io/docs/prometheus/latest/configuration/configuration/.
To facilitate mapping the configuration file to the Prometheus Pod, we need to place the configuration in a ConfigMap and then mount it to the Pod. The configuration content can be reviewed in config-map.yaml. The config-map.yaml defines many scraping data source rules, such as collecting data from the Kubernetes cluster and node exporter, and the configuration can refer to:
    scrape_configs:
      - job_name: 'node-exporter'
        kubernetes_sd_configs:
          - role: endpoints
        relabel_configs:
        - source_labels: [__meta_kubernetes_endpoints_name]
          regex: 'node-exporter'
          action: keep
You can open https://raw.githubusercontent.com/bibinwilson/kubernetes-prometheus/master/config-map.yaml to preview this file online.
Create the ConfigMap:
kubectl create -f config-map.yaml
This configuration is crucial and needs to be customized based on the practical situation, typically handled by operations; we will not discuss it further here.
Next, we will deploy Prometheus. Since the example files utilize an empty volume to store Prometheus data, this means that data will be lost if the Pod restarts, so we can change it to a hostPath volume.
Open the prometheus-deployment.yaml file:
Change
emptyDir: {}
to
          hostPath:
            path: /data/prometheus
            type: Directory
This change is optional.
If changed, the
/data/prometheusdirectory should be created on the node where this Pod is scheduled.
部署 Prometheus:
kubectl create -f prometheus-deployment.yaml
查看部署状态:
root@master:~# kubectl get deployments --namespace=monitoring
NAME                    READY   UP-TO-DATE   AVAILABLE   AGE
prometheus-deployment   1/1     1            1           23h
为了在外界访问 Prometheus,需要创建 Service:
apiVersion: v1
kind: Service
metadata:
  name: prometheus-service
  namespace: monitoring
  annotations:
      prometheus.io/scrape: 'true'
      prometheus.io/port:   '9090'

spec:
  selector:
    app: prometheus-server
  type: NodePort
  ports:
    - port: 8080
      targetPort: 9090
      nodePort: 30000
kubectl create -f prometheus-service.yaml
接下来可以访问 Prometheus UI 面板。
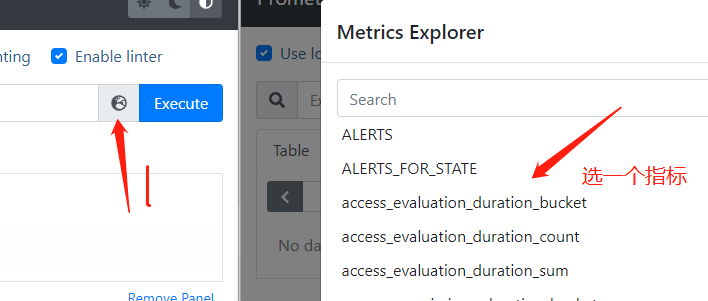
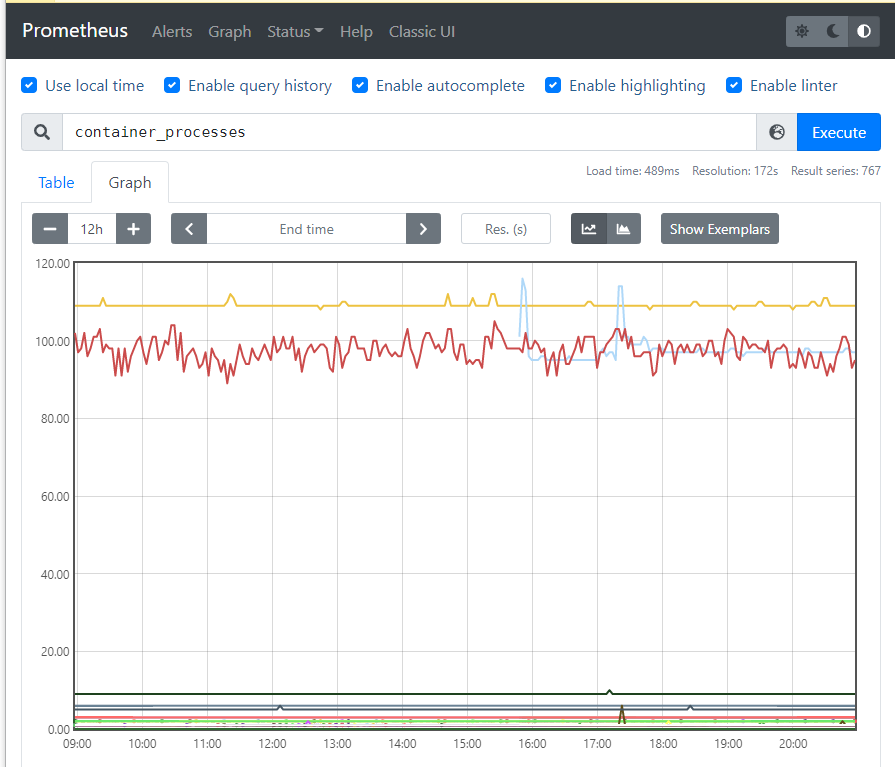
点击 Graph,点击 🌏 图标,选择需要显示的指标值,再点击 Execute 查询显示。
你还可以在 Service Discovery 中,查看 Prometheus 采集的 metrics 数据源。
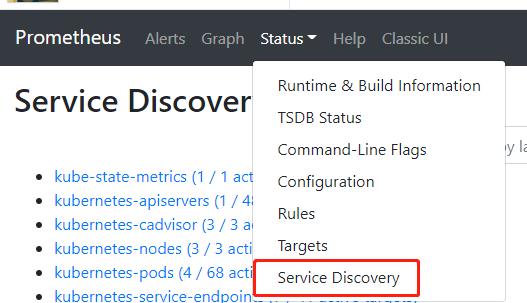
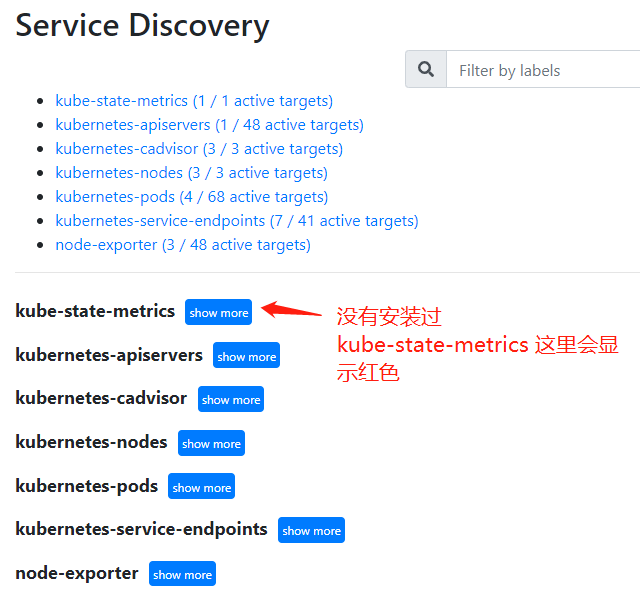
如果你的集群没有安装过 kube-state-metrics,那么这个数据源会显示红色标记,在下一节中,我们继续部署这个组件。
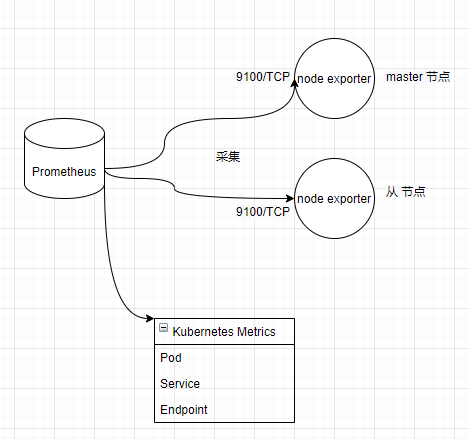
至此,我们的监控结构如下所示:
部署 Kube State Metrics
本节参考资料:https://devopscube.com/setup-kube-state-metrics/
Kube State Metrics 是一个服务,它与 Kubernetes API Server 通信,以获取所有 API 对象的详细信息,如 Deployment、Pod 等。
Kube State Metrics 提供了无法直接从本地 Kubernetes 监视组件获得的 Kubernetes 对象和资源度量,因为 Kubernetes Metrics 本身提供的指标并不是很全面,因此需要 Kube State Metrics 以获得与 Kubernetes 对象相关的所有度量。
以下是可以从 Kube State Metrics 中获得的一些重要度量:
- Node status, node capacity (CPU and memory)
- Replica-set compliance (desired/available/unavailable/updated status of replicas per deployment)
- Pod status (waiting, running, ready, etc)
- Ingress metrics
- PV, PVC metrics
- Daemonset & Statefulset metrics.
- Resource requests and limits.
- Job & Cronjob metrics
可以在这里的文档中查看受支持的详细指标:https://github.com/kubernetes/kube-state-metrics/tree/master/docs
Bibin Wilson 大佬已经封装好了相关的部署定义文件,我们直接下载即可:
git clone https://github.com/devopscube/kube-state-metrics-configs.git
直接应用所有 YAML 创建对应的资源:
kubectl apply -f kube-state-metrics-configs/
├── cluster-role-binding.yaml
├── cluster-role.yaml
├── deployment.yaml
├── service-account.yaml
└── service.yaml
上面创建的资源,包含以下部分,这一小节,就不展开讲解。
- Service Account
- Cluster Role
- Cluster Role Binding
- Kube State Metrics Deployment
- Service
使用以下命令检查部署状态:
kubectl get deployments kube-state-metrics -n kube-system
随后,刷新 Prometheus Service Discovery,可以看到红色变成了蓝色,点击此数据源,可以看到以下信息:
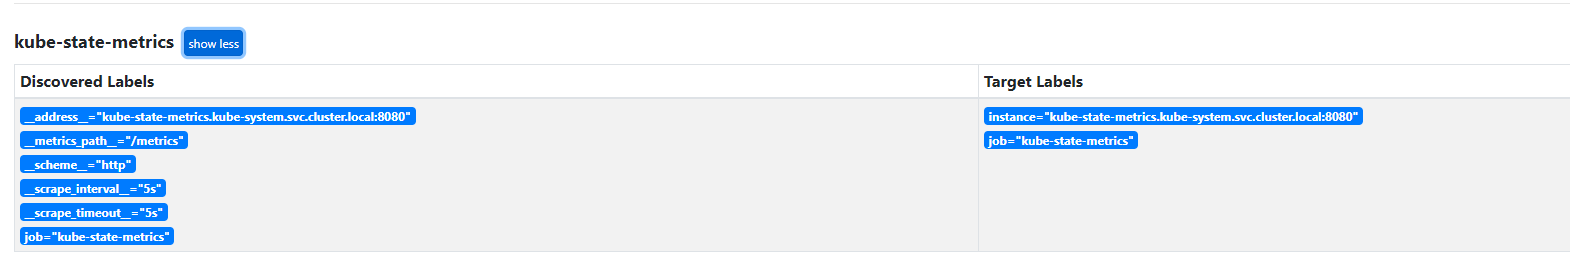
- job_name: 'kube-state-metrics'
  static_configs:
    - targets: ['kube-state-metrics.kube-system.svc.cluster.local:8080']
此配置为 kube-state-metrics 的访问地址。
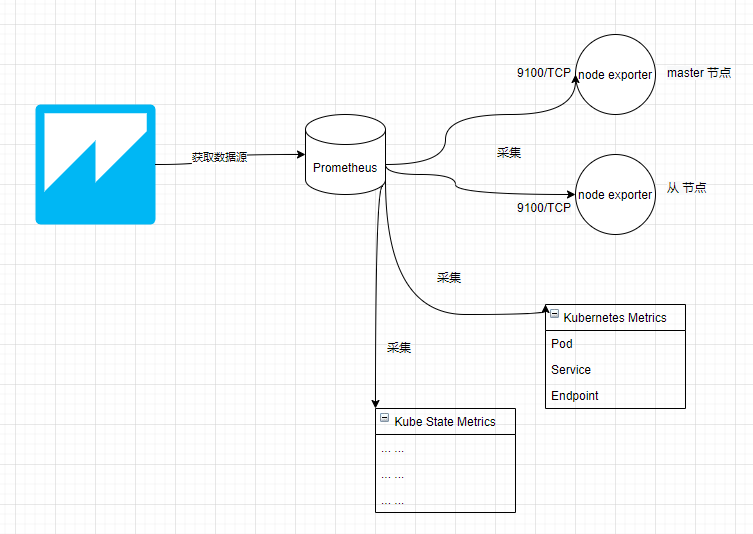
在此,我们部署的 Prometheus 结构如下:
部署 Grafana
本节参考资料:https://devopscube.com/setup-grafana-kubernetes/
经过前面几个小节的部署,已经搞好数据源的采集以及数据存储,接下来我们将部署 Grafana,利用 Grafana 对指标数据进行分析以及可视化。
Bibin Wilson 大佬已经封装好了相关的部署定义文件,我们直接下载即可:
git clone https://github.com/bibinwilson/kubernetes-grafana.git
首先查看 grafana-datasource-config.yaml 文件,此配置是为了 Grafana 自动配置好 Prometheus 数据源。
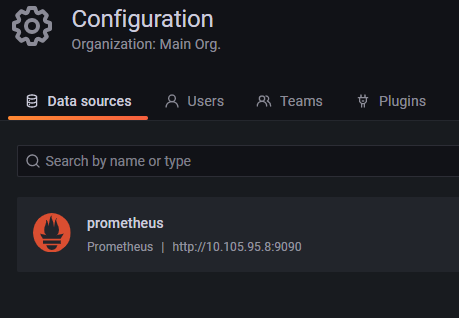
里面还有一个很重要的地址:
"url": "http://prometheus-service.monitoring.svc:8080",
这里要确认你的 CoreDNS 是否正常,你可以参考 https://kubernetes.io/zh/docs/tasks/administer-cluster/dns-debugging-resolution/ 中列举的 DNS 调试方法,确认你的集群中是否可以通过 DNS 访问 Pod。最简单的方法是启动一个 Pod,然后使用命令测试 curl http://prometheus-service.monitoring.svc:8080,看看能不能获取到响应数据,如果出现:
root@master:~/jk/kubernetes-prometheus# curl http://prometheus-deployment.monitoring.svc:8080
curl: (6) Could not resolve host: prometheus-deployment.monitoring.svc
root@master:~/jk/kubernetes-prometheus# curl http://prometheus-deployment.monitoring.svc.cluster.local:8080
curl: (6) Could not resolve host: prometheus-deployment.monitoring.svc.cluster.local
可能是你 coredns 没有安装或者别的原因,导致无法通过此地址访问 Prometheus,为了避免过多操作,可以改为使用 IP,而不是域名。
查看 Prometheus 的 Service IP:
root@master:~/jk/kubernetes-prometheus# kubectl get svc -n monitoring
NAME                    TYPE        CLUSTER-IP      EXTERNAL-IP   PORT(S)          AGE
prometheus-deployment   NodePort    10.105.95.8     <none>        9090:32330/TCP   23h
测试通过 Service IP 访问是否正常:
root@master:~/jk/kubernetes-prometheus# curl 10.105.95.8:9090
<a href="/graph">Found</a>.
将 grafana-datasource-config.yaml 中的 prometheus-deployment.monitoring.svc.cluster.local:8080 改成对应的 Service IP,并且端口改成 9090。
创建配置:
kubectl create -f grafana-datasource-config.yaml
打开 deployment.yaml 查看定义,模板中 grafana 的数据存储也是使用 empty 卷,有数据丢失风险,因此可以改成用 hostPath 或其他类型的卷存储。可参考笔者的配置:
      volumes:
        - name: grafana-storage
          hostPath:
            path: /data/grafana
            type: Directory
部署 Grafana:
kubectl create -f deployment.yaml
然后创建 Service:
kubectl create -f service.yaml
接着可以通过 32000 端口访问 Grafana。
账号密码都是 admin
至此,我们部署的 Prometheus 监控结构如下:
刚刚进去的时候空空如也,我们需要利用图表模板制作可视化界面,才能显示出漂亮的数据。
在 Grafana 官方网站中,有很多社区制作的免费的模板 https://grafana.com/grafana/dashboards/?search=kubernetes
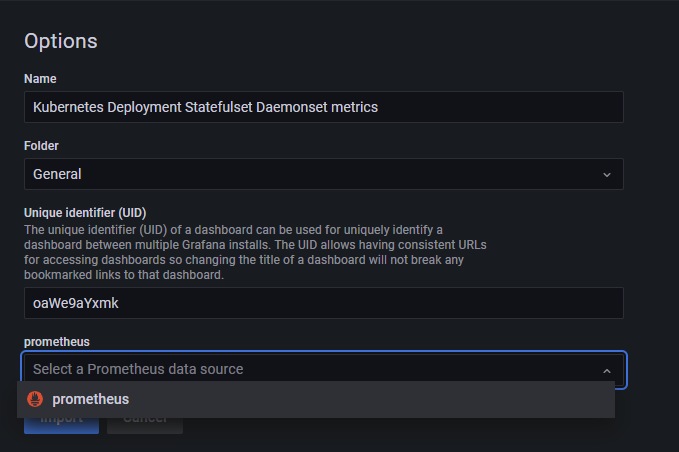
首先打开 https://grafana.com/grafana/dashboards/8588 下载这个模板,然后上传模板文件,并绑定对应的 Prometheus 数据源。
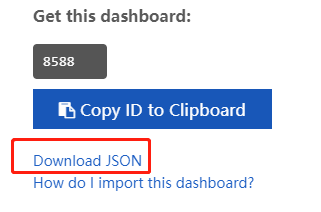
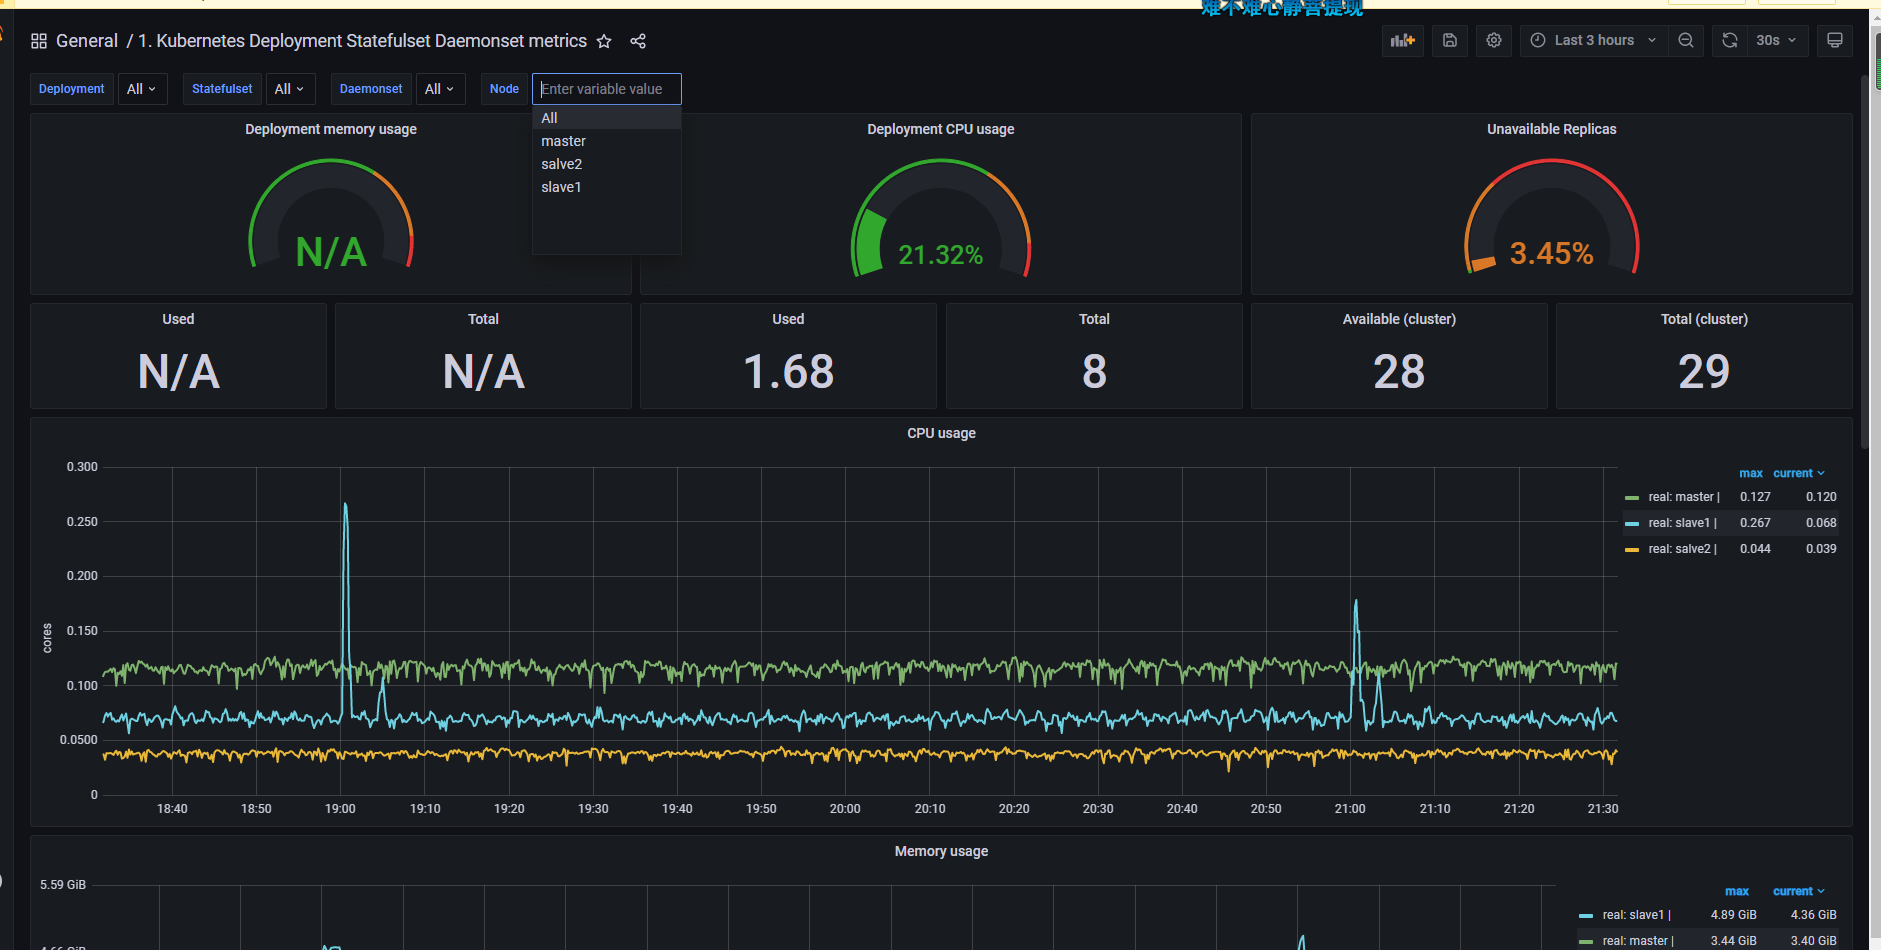
接下来就可以看到对应的监控界面了。
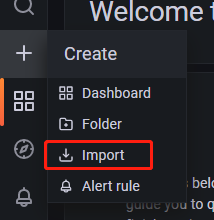
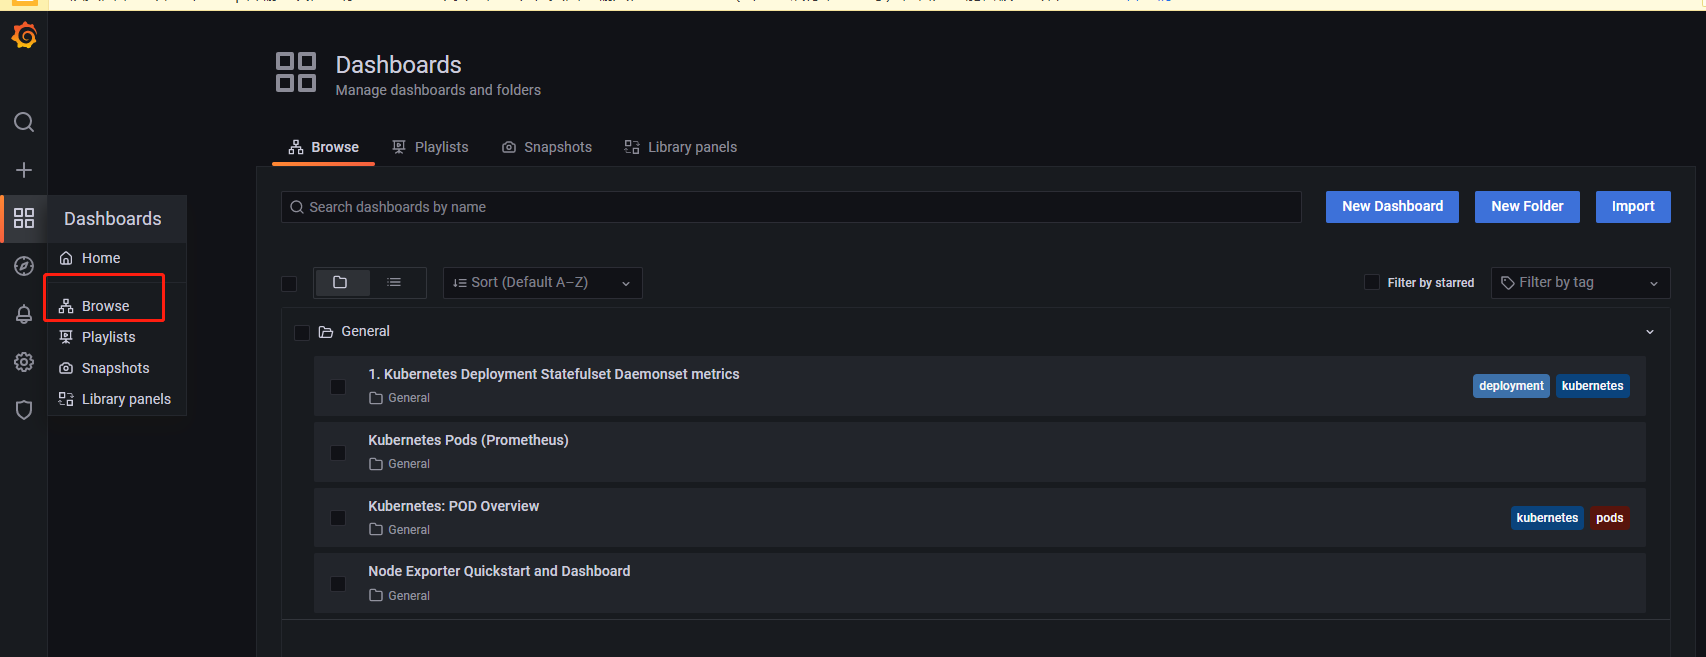
你可以打开 Browse,继续导入更多的模板,然后查看要显示的模板监控界面。
应用如何接入 Prometheus 和 Grafana
前面已经提及对基础设施的监控,我们还可以对中间件如 TIDB、Mysql 等生成、收集指标数据,还可以在程序中自定义指标数据,然后自行制作 Grafana 模板。如果你是 .NET 开发,还可以参考笔者的另一篇文章来一步步了解这些过程:https://www.cnblogs.com/whuanle/p/14969982.html
告警
在监控体系中,告警是重中之重,一般需要根据公司的实际情况自研告警处理和推送通知组件。
我们建议您阅读基于 Rob Ewaschuk 在 Google 的观察的我的警报哲学:https://docs.google.com/a/boxever.com/document/d/199PqyG3UsyXlwieHaqbGiWVa8eMWi8zzAn0YfcApr8Q/edit
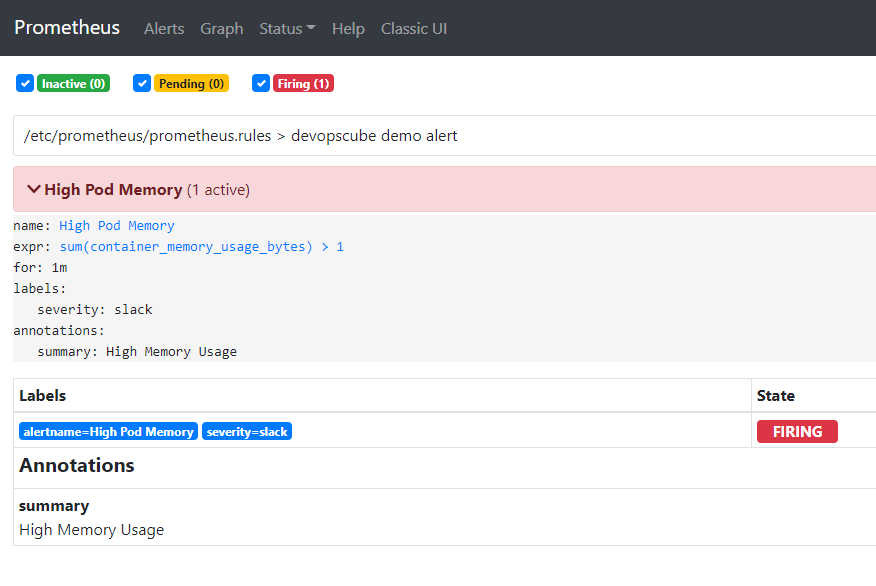
在前面部署 Prometheus 时,config-map.yaml 便已经定义了一个告警规则。
  prometheus.rules: |-
    groups:
    - name: devopscube demo alert
      rules:
      - alert: High Pod Memory
        expr: sum(container_memory_usage_bytes) > 1
        for: 1m
        labels:
          severity: slack
        annotations:
          summary: High Memory Usage
一条告警规则主要由以下几部分组成:
- alert:告警规则的名称。
- expr:基于 PromQL 表达式告警触发条件,用于计算是否有时间序列满足该条件。
- for:评估等待时间,可选参数。用于表示只有当触发条件持续一段时间后才发送告警。在等待期间新产生告警的状态为 pending。
- labels:自定义标签,允许用户指定要附加到告警上的一组附加标签。
- annotations:用于指定一组附加信息,比如用于描述告警详细信息的文字等,annotations 的内容在告警产生时会一同作为参数发送到 Alertmanager。
可参考:https://yunlzheng.gitbook.io/prometheus-book/parti-prometheus-ji-chu/alert/prometheus-alert-rule
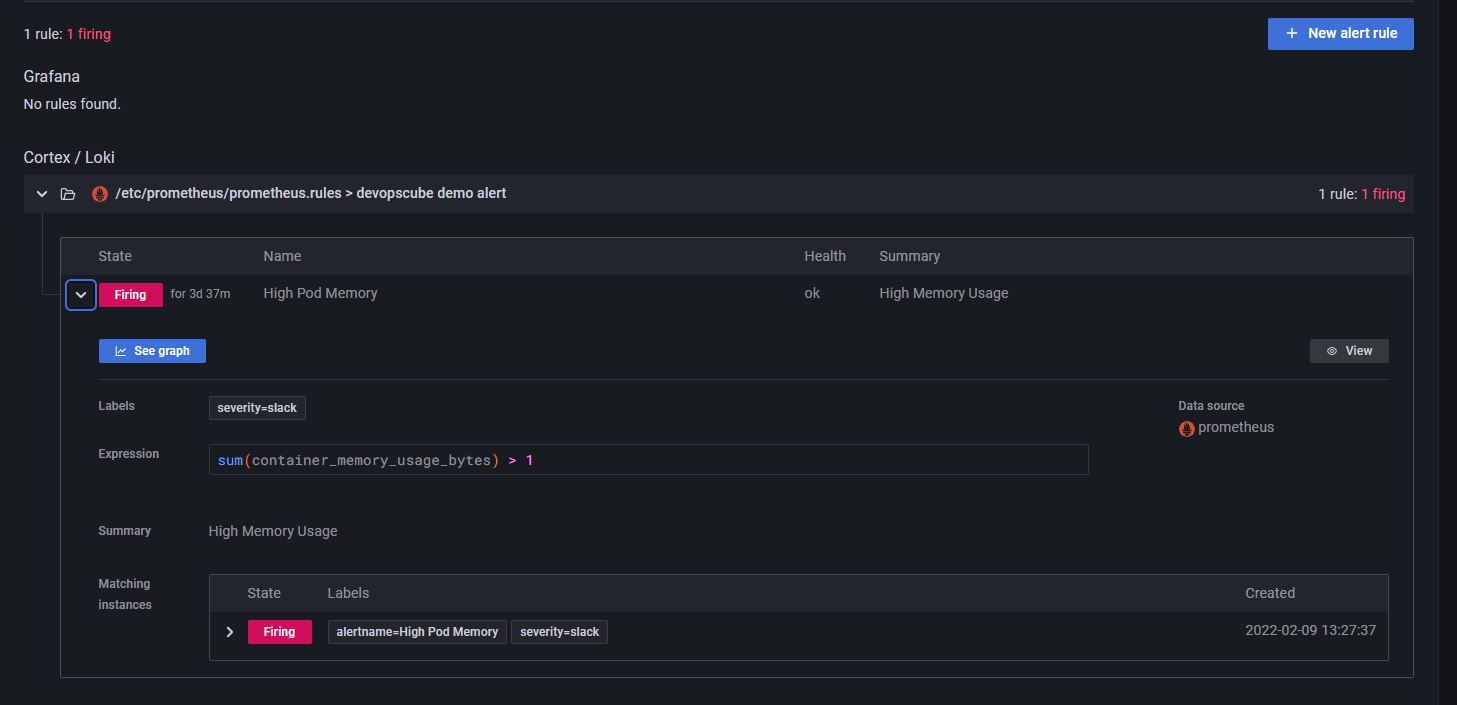
在 Grafana 中也可以看到这条规则。
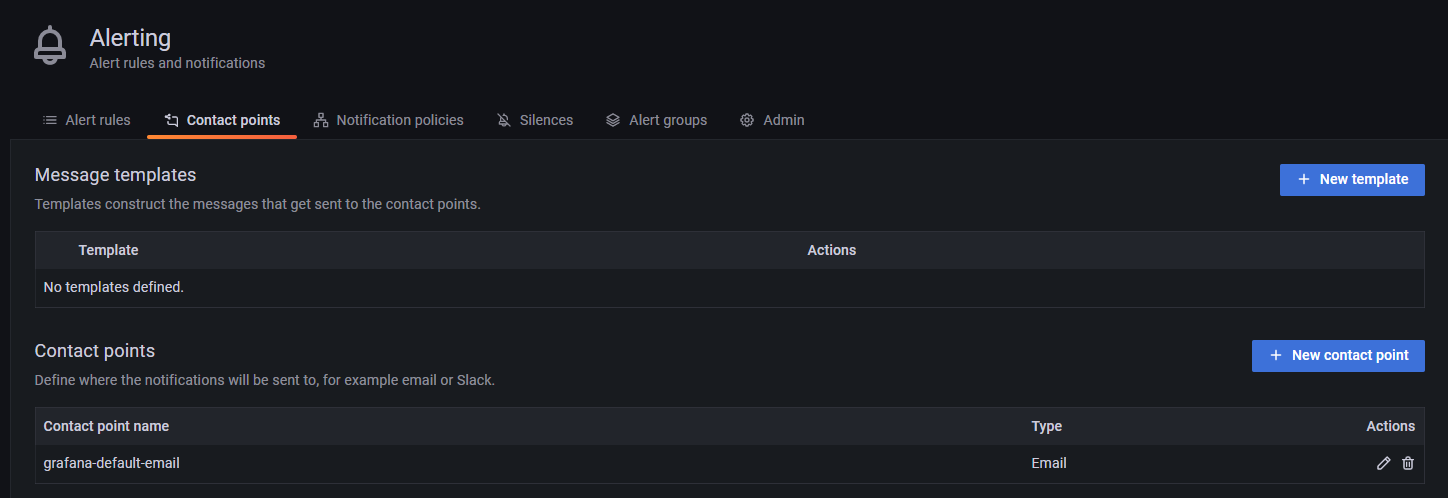
下面我们将来配置告警通知。
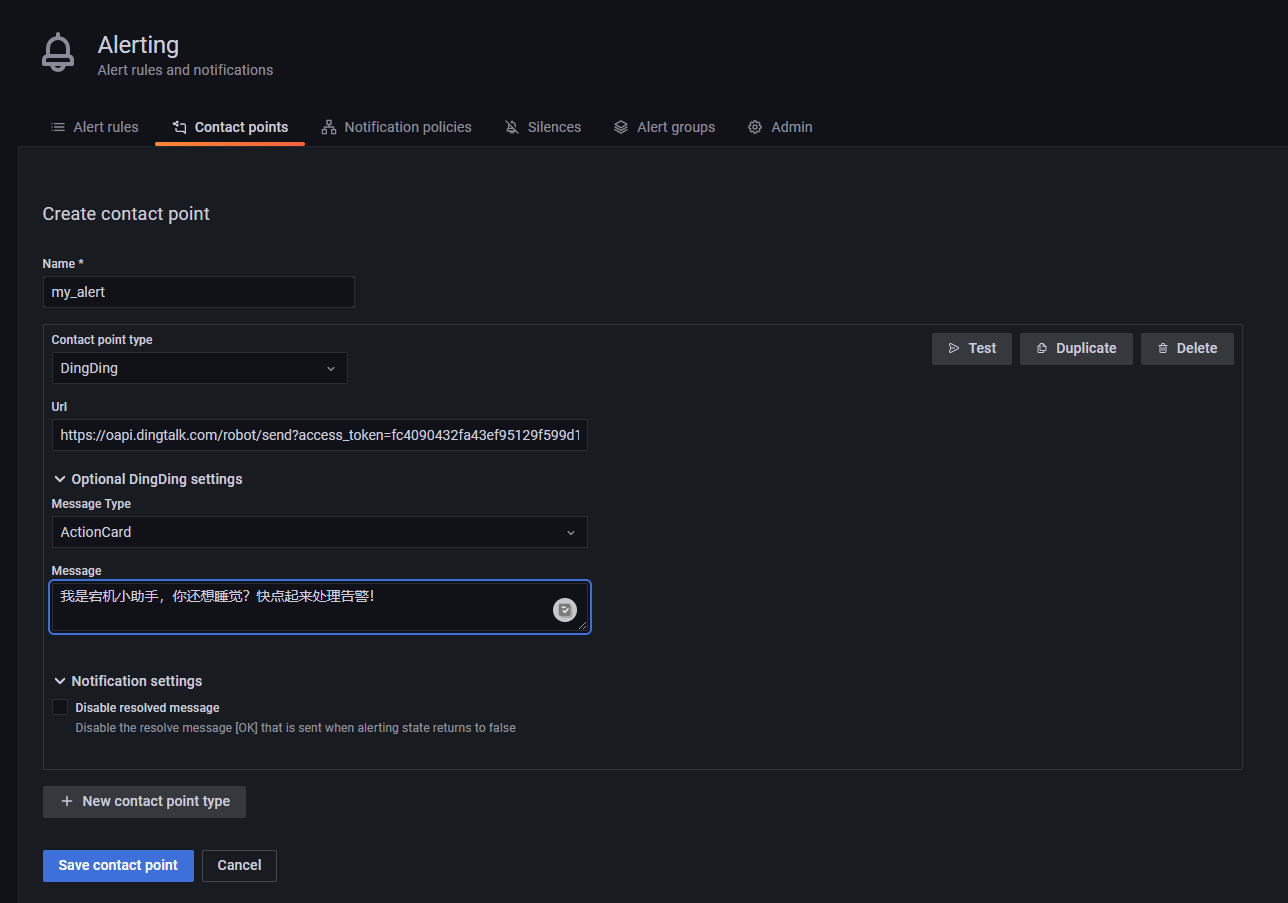
首先创建一个告警联系方式,笔者使用了钉钉 Webhook。
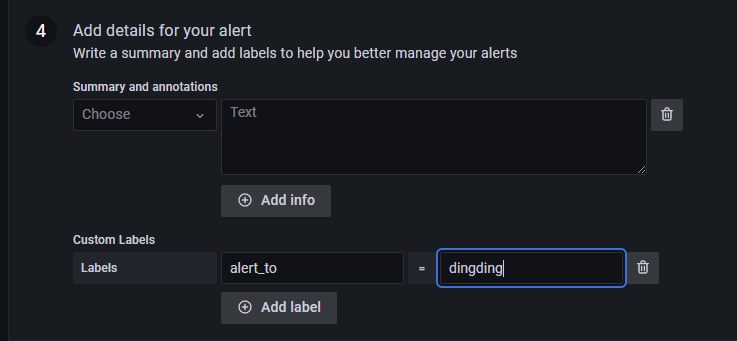
然后找 Alert Rules,添加一个新的告警规则。
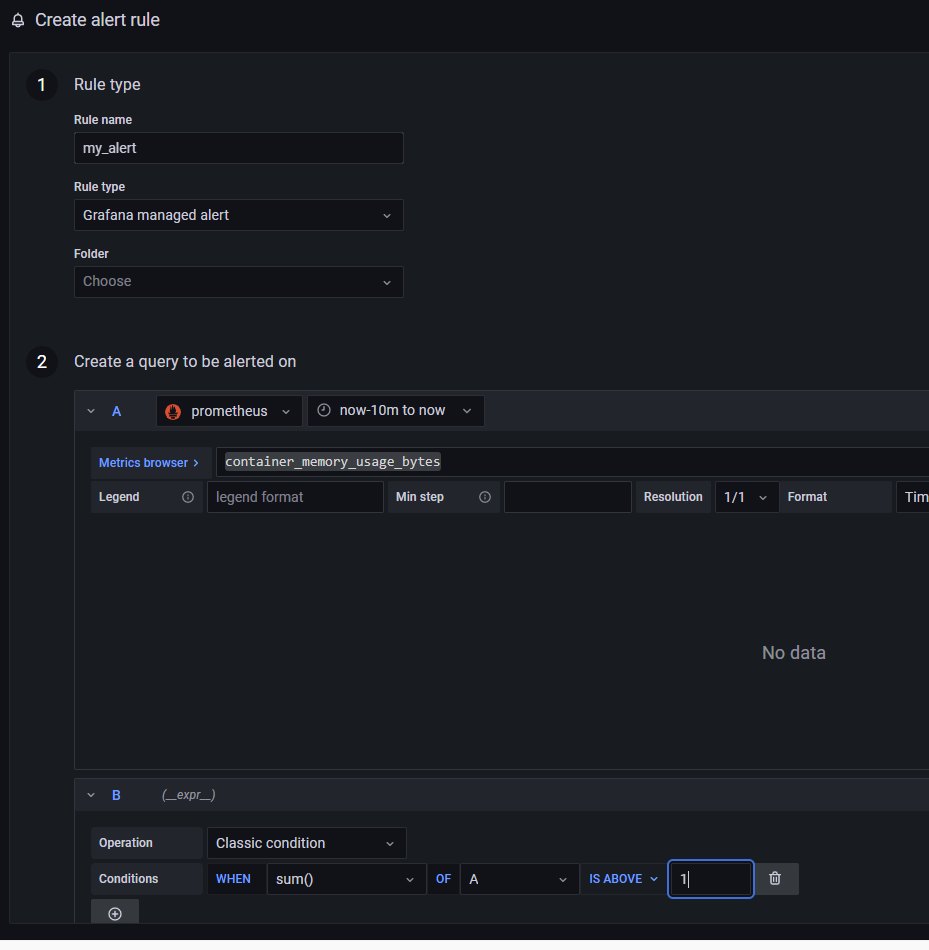
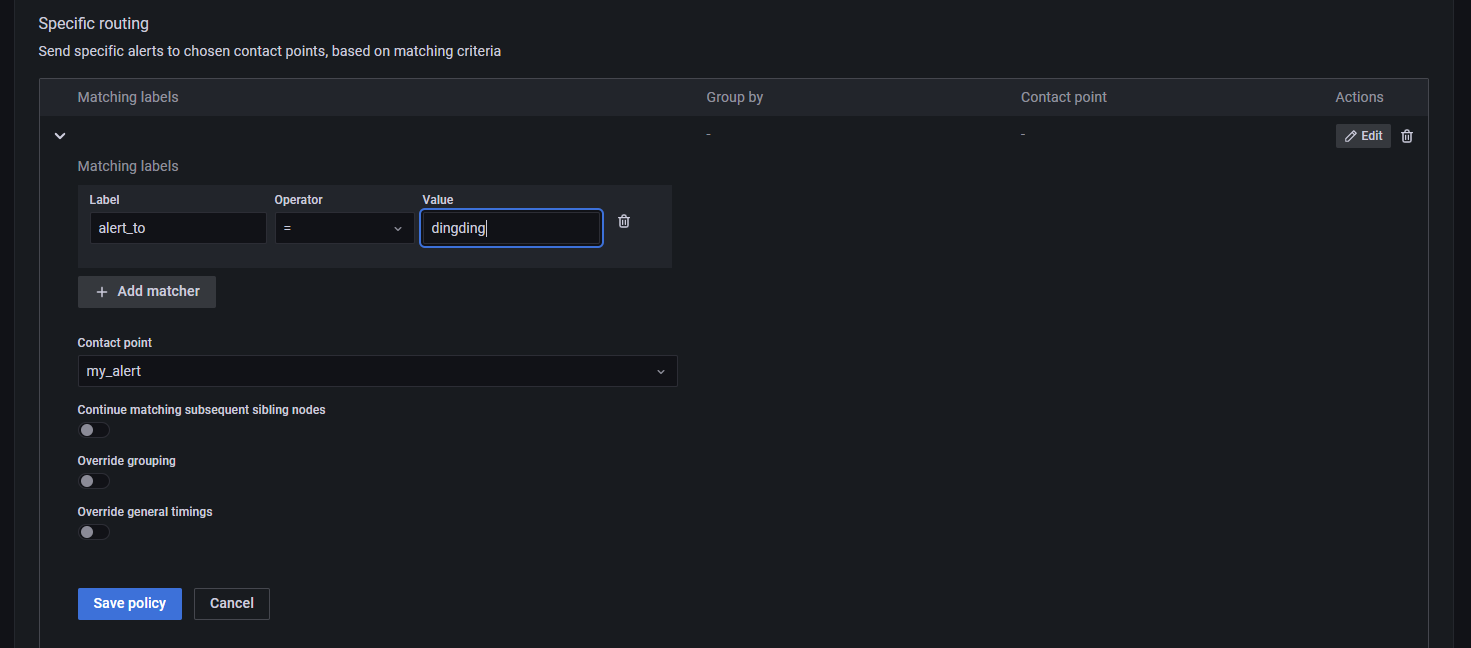
接着打开 Notification policies,为告警规则和联系方式做绑定,符合条件的告警信息将会被推送到指定的联系方式中。
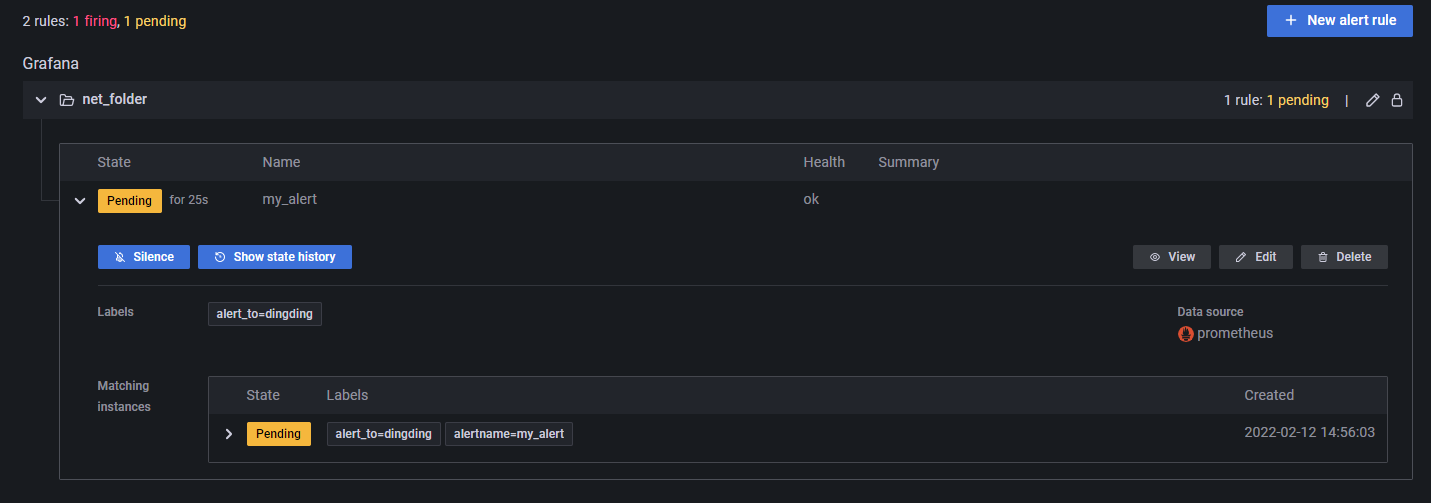
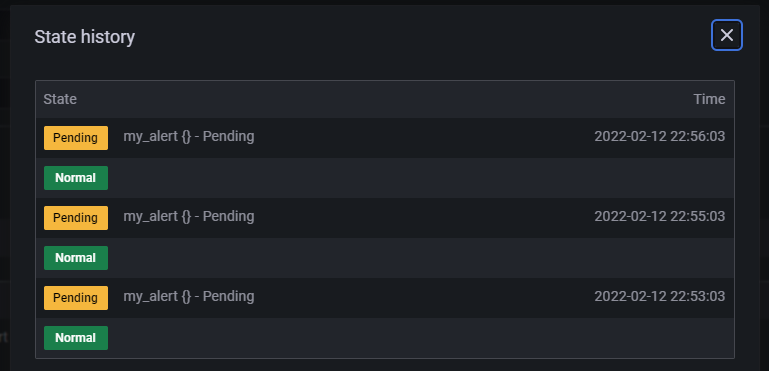
在 Alert Rules 中可以看到告警信息的推送记录。由于笔者的服务器在国外,可能导致服务器无法使用钉钉的 Webhook 功能,因此这里一直在 Pending,因此笔者这里就不再做过多的尝试了,读者了解大概步骤即可。

文章评论