Kubernetes Logging and EFK Logging Solution
This article mainly references the following two articles and integrates and translates their contents.
https://devopscube.com/kubernetes-logging-tutorial/
https://devopscube.com/setup-efk-stack-on-kubernetes/
Part One: Kubernetes Logging
In this Kubernetes logging tutorial, you will learn key concepts and workflows involved in logging for Kubernetes clusters.
Logs play a crucial role in debugging Kubernetes production environments. They can help you understand what is happening, where issues might arise, and even where potential problems could occur. As a DevOps engineer, you should have a clear understanding of Kubernetes logging to resolve cluster and application issues.
How Kubernetes Logging Works
In Kubernetes, most components run in containers. In the Kubernetes architecture, an application Pod can contain multiple containers, and most Kubernetes cluster components, such as api-server, kube-scheduler, Etcd, kube-proxy, etc., run as containers. However, the kubelet component runs as a native systemd service.
In this section, we will look at how logging works for Kubernetes Pods. It can be an Application Pod or a Kubernetes component Pod. We will also explore how to manage kubelet systemd logs.
Typically, any Pod deployed on Kubernetes writes logs to stdout and stderr streams instead of writing logs to dedicated log files. However, the streams from stdout and stderr of each container are stored in JSON format in the filesystem. The underlying container engine takes care of this, and it is designed to handle logging. For instance, using the Docker container engine.
Note from the author: This means that logs from container applications are collected by the container engine when outputted to the console, and these log streams are stored as JSON files in the filesystem.
The method of collecting logs from containers will be discussed later.
Note: All logs from Kubernetes cluster components are processed the same way as other container logs.
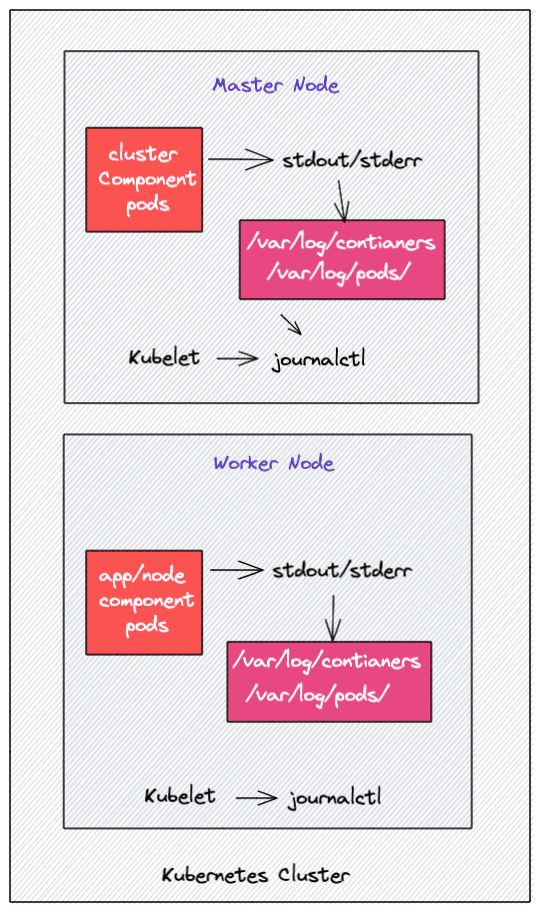
The kubelet runs on all nodes to ensure containers are running properly on the nodes. It is also responsible for the static Pods it manages, and if kubelet runs as a systemd service, it logs to journald (systemd-journald).
Additionally, if containers do not send logs to stdout and stderr, you will not be able to use the kubectl logs command to access the logs, as kubelet cannot access the log files.
Note from the author: For example, if a Pod is running on Node B, but you execute the
kubectl logscommand on Node A, the Pod's logs will not simply appear; they are transferred via kubelet.
This subsection indicates that the application's logs must be output through stdout and stderr for Kubernetes to utilize them (kubectl logs), and the component responsible for transferring logs between nodes is called kubelet. Since kubelet runs as systemd rather than a Pod, its own logs must be accessed via systemd-journald.
Kubernetes Pod Log Storage Locations
You can find the Kubernetes stored logs for Pods in the following directories on each worker node.
- /var/log/containers: All container logs are located in one single place;
- /var/log/pods/: Under this location, container logs are organized into separate folders for each Pod:
/var/log/pods/<namespace>_<pod_name>_<pod_id>/<container_name>/. Each Pod folder contains a folder for a single container along with its respective log files. Each folder follows a naming scheme;
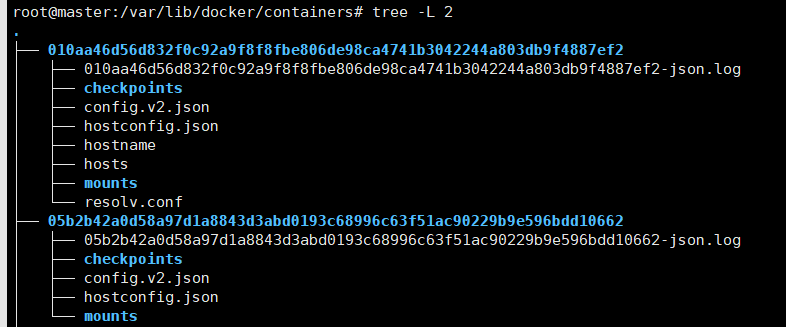
Additionally, if your underlying container engine is Docker, you will find logs in the /var/lib/docker/containers folder.
Logs are recorded in JSON format, along with some property information.
{"log":"Shutting down, got signal: Terminated\n","stream":"stderr","time":"2021-11-09T06:14:42.535854831Z"}
If you log into any Kubernetes worker node and navigate to the /var/log/containers directory, you will find log files for each container running on that node. The naming scheme for log files follows /var/log/pods/<namespace>_<pod_name>_<pod_id>/<container_name>/. The image below shows an example.
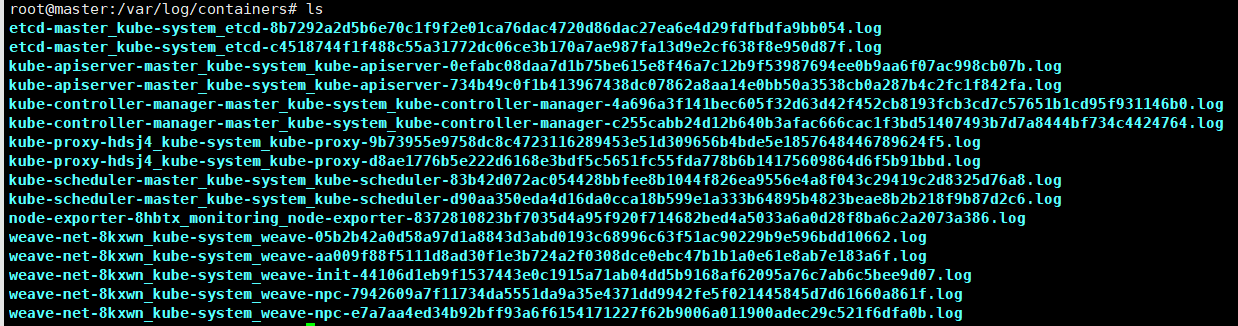
Moreover, these log files are managed by Kubelet, so when you run the kubectl logs command, Kubelet displays these logs in the terminal.
Kubelet Logs
For Kubelet, you can access the logs from a single worker node using journalctl. For example, use the following commands to check the Kubelet logs.
journalctl -u kubelet
journalctl -u kubelet -o cat
If Kubelet runs without systemd, you can find Kubelet logs in the /var/log directory.
Kubernetes Container Log Format
Below is an example of one line of log data from a container:
{"log":"Shutting down, got signal: Terminated\n","stream":"stderr","time":"2021-11-09T06:14:42.535854831Z"}
As previously mentioned, all log data is stored in JSON format. Therefore, if you open any log file, you will find that each log entry has three keys.
log- the actual log datastream- the stream from which the log is writtentime- timestamp of the log
Types of Kubernetes Logs
When it comes to Kubernetes, here are the different types of logs.
-
Application logs: Logs from user-deployed applications. Application logs help understand what is going on inside the application.
-
Kubernetes Cluster components: Logs from the api-server, kube-scheduler, etcd, kube-proxy, etc.
-
Kubernetes Audit logs: Logs related to API activities recorded by the API server. Primarily used to investigate suspicious API activity.
Kubernetes Logging Architecture
If we consider the Kubernetes cluster as a whole, then we need to consolidate logs uniformly. However, Kubernetes does not provide any logging collection functionality, so you need to set up a centralized logging backend (e.g., Elasticsearch) and send all logs to that backend. The image below depicts a high-level Kubernetes Logging architecture.
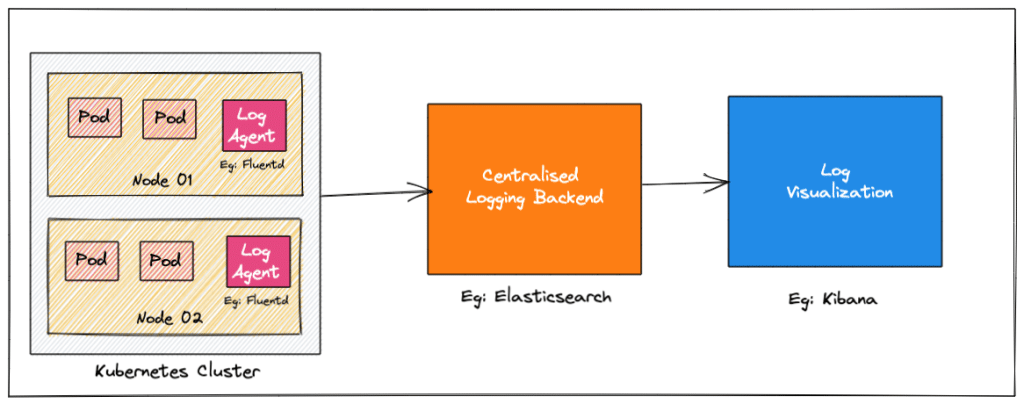
Let’s take a look at the three key components of logging.
- Logging Agent: A log agent that can run as a daemonset on all Kubernetes nodes, continuously collecting logs to the logging backend. A log agent can also run as a sidecar container. For instance, Fluentd.
- Logging Backend: A centralized system capable of storing, searching, and analyzing log data.
- Log Visualization: Tools that visualize log data in the form of dashboards.
Kubernetes Logging Patterns
This section will explore some Kubernetes logging patterns to stream logs to the logging backend. There are three key logging patterns for Kubernetes clusters:
- Node level logging agent
- Streaming sidecar container
- Sidecar logging agent
Let’s take a closer look at the characteristics of each approach.
Node Level Logging Agent
In this approach, each node runs an agent (e.g., Fluentd) that reads log files created from container STDOUT and STDERR streams and sends them to a logging backend like Elasticsearch. This is a commonly used logging pattern that works well without any overhead.
The 12-factor app approach in cloud-native also recommends sending logs through STDOUT.
Reference: https://12factor.net/logs
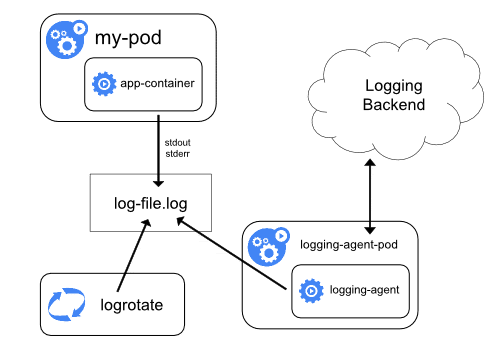
Streaming Sidecar Container
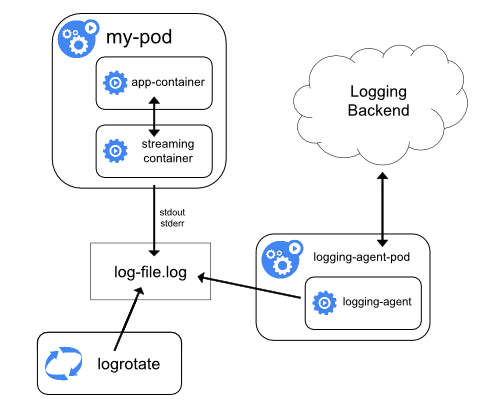
When an application cannot write logs directly to STDOUT and STDERR stream, this sidecar approach is very useful.
The application containers in the Pod write all logs to a file within the container. Then, a sidecar container in the Pod reads data from that log file and streams it to STDOUT and STDERR, utilizing the Node Level Logging Agent for collection.
Application log custom file -> redirect stream to STDOUT -> container engine collects
Sidecar Logging Agent
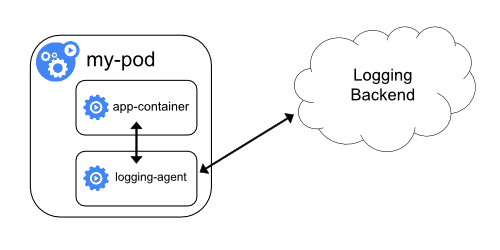
In this approach, logs are not streamed to STDOUT and STDERR. Instead, a sidecar container with a logging agent runs alongside the application container. The logging agent then pushes log streams directly to the logging backend.
In other words, the sidecar container in the Pod pushes log directly to the logging backend without needing collection by the container engine.
There are two disadvantages to this method.
- Running a logging agent as a sidecar is resource-intensive and consumes a lot of IO.
- You cannot use the
kubectl logscommand to obtain logs because Kubelet does not process the logs.
Kubernetes Logging Tools
The most commonly used open-source logging stack for Kubernetes is EFK (Elasticsearch, Fluentd/Fluentbit, and Kibana).
The EFK solution consists of the following three main components:
- Elasticsearch – Log aggregator
- Fluentd/Fluentbit – Logging agent (Fluentbit is a lightweight agent designed for container workloads)
- Kibana – Log visualization and dashboard tool
When it comes to managed Kubernetes services like Google GKE, AWS, and Azure AKS, they integrate cloud-specific centralized logging. Therefore, when you deploy a managed Kubernetes cluster, you will have the option to enable logging monitoring in the respective logging services, such as:
- AWS EKS uses CloudWatch
- Google GKE uses Stackdriver monitoring
- Azure AKS uses Azure Monitor
Need to operate in the cloud.
In addition, organizations may use enterprise logging solutions like Splunk. In such cases, logs are forwarded to Splunk monitoring and adhere to the organization’s logging retention policies. Here are some enterprise logging solutions:
Kubernetes Logging and EFK
In Kubernetes, one of the best open-source logging solutions currently available is EFK, which includes Elasticsearch, Fluentd, and Kibana.
In Part Two, we will deploy the EFK logging solution in a Kubernetes cluster.
Part Two: EFK Practice
In Part One, the basic principles and patterns of Kubernetes logging were introduced for beginners. In Part Two, you will learn how to set up EFK for log streaming, analysis, and monitoring in a Kubernetes cluster.
When running multiple applications and services on a Kubernetes cluster, it makes more sense to stream all application and Kubernetes cluster logs to a centralized logging infrastructure for log analysis. Part Two aims to introduce you to the important technical aspects of Kubernetes logging through the EFK stack.
EFK Stack
EFK stands for Elasticsearch, Fluentd, and Kibana. EFK is a popular and best open-source option for Kubernetes log aggregation and analysis.
- Elasticsearch is a distributed and scalable search engine commonly used to filter large volumes of log data. It is a NoSQL database based on the Lucene search engine (a search library from Apache). Its primary role is to store logs and retrieve them from Fluentd.
- Fluentd is a log collection processor; it is an open-source log collection agent that supports multiple data sources and output formats. Moreover, it can forward logs to Stackdriver, Cloudwatch, Elasticsearch, Splunk, BigQuery, etc. In short, it is a unifying layer between log data generation systems and log data storage systems.
- Kibana is a UI tool for querying, data visualization, and dashboards. It is a query engine that allows you to explore your log data through a web interface, build visualizations for event logs, and filter information specific to query in order to detect issues. You can virtually construct any type of dashboard using Kibana. Kibana Query Language (KQL) is used to query Elasticsearch data. Here, we use Kibana to query indexed data in Elasticsearch.
Additionally, Elasticsearch helps address the issue of separating large amounts of unstructured data; many organizations are now using Elasticsearch, typically deployed together with Kibana.
Note: When it comes to Kubernetes, Fluentd is the better choice since it can parse container logs without any additional configuration compared to Logstash. Furthermore, it is a CNCF project.
Setting Up EFK on Kubernetes
Next, we will step-by-step deploy and configure EFK on Kubernetes. You can find all the deployment definition files used in this blog in the Kubernetes EFK GitHub repo, with each EFK component’s YAML definition files placed in different directories.
First, clone the repository:
git clone https://github.com/scriptcamp/kubernetes-efk
Note that the EFK components deployed in this article will all be in the default namespace of Kubernetes.
The file structure of the repository is as follows:
├── kubernetes-efk
│   ├── README.md
│   ├── elasticsearch
│   │   ├── es-sts.yaml
│   │   └── es-svc.yaml
│   ├── fluentd
│   │   ├── fluentd-ds.yaml
│   │   ├── fluentd-rb.yaml
│   │   ├── fluentd-role.yaml
│   │   └── fluentd-sa.yaml
│   ├── kibana
│   │   ├── kibana-deployment.yaml
│   │   └── kibana-svc.yaml
│   └── test-pod.yaml
EFK Architecture
The following diagram shows the high-level architecture of the EFK we are going to build.
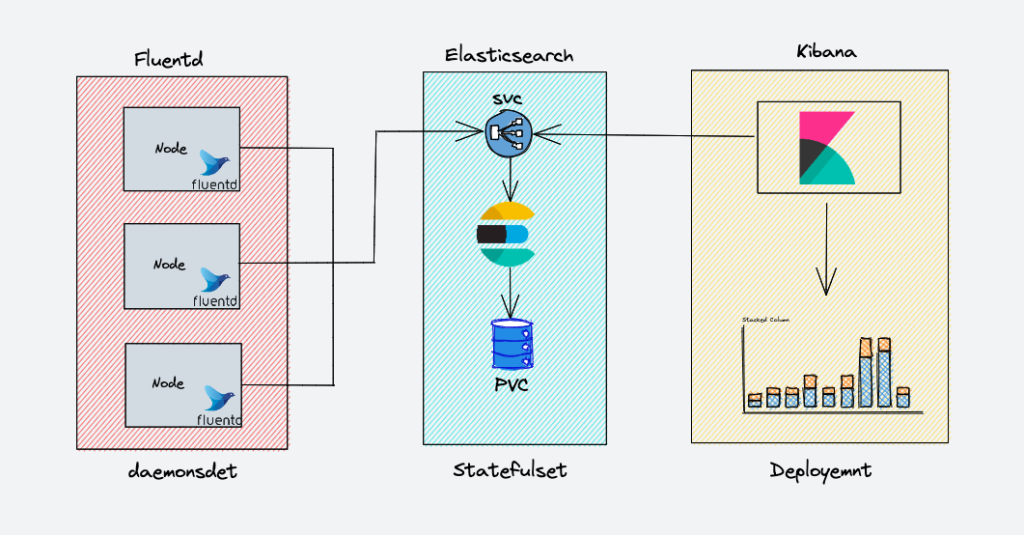
The deployment instructions for the EFK components are as follows:
- Fluentd: Deployed as a daemon to collect container logs from all nodes as needed. It connects to the Elasticsearch service endpoint to forward logs.
- Elasticsearch: Deployed as a stateful set for storing log data. We also expose the service endpoints for Fluentd and Kibana to connect to it.
- Kibana: Deployed as a deployment and connects to the Elasticsearch service endpoint.
Deploying Elasticsearch Statefulset
Elasticsearch is deployed as a StatefulSet, with multiple replicas connecting to each other through a headless service. Headless services provide DNS guidance for the Pods.
Open the elasticsearch/es-svc.yaml file to see the following definitions:
apiVersion: v1
kind: Service
metadata:
  name: elasticsearch
  labels:
    app: elasticsearch
spec:
  selector:
    app: elasticsearch
  clusterIP: None
  ports:
    - port: 9200
      name: rest
    - port: 9300
      name: inter-node
Let’s create it now.
kubectl create -f es-svc.yaml
Before we start creating the StatefulSet for Elasticsearch, let’s recall that StatefulSet requires a predefined storage class to create volumes when needed.
Note: While a production environment might require a 400-500 GB SSD for ES storage, this YAML file is defined for 3GB PV in the storage environment here.
The author mounted a 512GB enterprise-grade SSD specifically for learning about EFK.
In the elasticsearch/es-sts.yaml file, it will automatically create a storage volume of 3GB, defined as follows:
    spec:
      accessModes: [ "ReadWriteOnce" ]
      # storageClassName: ""
      resources:
        requests:
          storage: 3Gi
Since the author has their own disk, they mounted it to the slave2 node, so they do not need this configuration. The author uses NFS-PV, and of course, readers can continue using the above configuration to avoid hassle.
Readers can first deploy their own NFS storage by following https://k8s.whuanle.cn/5.volumes/3.nfts.html, and then create PV using the following template.
apiVersion: v1
kind: PersistentVolume
metadata:
  name: es-pv
spec:
  capacity:
    storage: 450Gi
  volumeMode: Filesystem
  accessModes:
    - ReadWriteOnce
  persistentVolumeReclaimPolicy: Recycle
  storageClassName: es-volume
  mountOptions:
    - hard
    - nfsvers=4.1
  nfs:
    path: /data/volumns/es
    server: 10.0.0.4
Readers must create NFS in advance and can refer to https://k8s.whuanle.cn/5.volumes/3.nfts.html to create their own cross-node storage system.
Change the volumeClaimTemplates section to:
  volumeClaimTemplates:
  - metadata:
      name: data
      labels:
        app: elasticsearch
    spec:
      accessModes: ["ReadWriteOnce"]
      storageClassName: "es-volume"
      resources:
        requests:
          storage: 450Gi
Then let’s take a look at the definition of the Elasticsearch cluster in the es-sts.yaml file:
          - name: discovery.seed_hosts
            value: "es-cluster-0.elasticsearch,es-cluster-1.elasticsearch,es-cluster-2.elasticsearch"
Here are two points to note: first, your cluster must have CoreDNS installed; second, the number of your replicas must match the replicas: 3 defined in es-sts.yaml. If you have three nodes (one master and two replicas), then replicas should be set to 2. However, generally, the number of Elasticsearch instances is odd. Thus, the author only sets to use one Elasticsearch instance.
Then deploy Elasticsearch:
kubectl create -f es-sts.yaml
Verify Elasticsearch Deployment
After the Elasticsearch Pod is running, let’s try to verify the Elasticsearch status set. The easiest way is to check the cluster status. To check the status, port forward the 9200 port of the Elasticsearch Pod.
kubectl port-forward es-cluster-0 19200:9200
The port-forward method is temporary, avoiding exposing Elasticsearch to the outside; alternatively, you can use the Service IP or other methods to test IP connectivity. You can also expose Elasticsearch using the Service NodePort method.
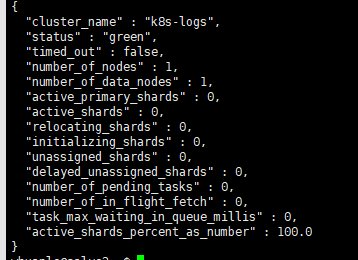
To check the health of the Elasticsearch cluster, run the following command in the terminal.
curl http://localhost:19200/_cluster/health/?pretty
The output will display the status of the Elasticsearch cluster. If all steps have been executed correctly, accessing this address will return a JSON response.
Deploy Kibana
Similar to deploying Elasticsearch, Kibana can be deployed using a simple YAML file. If you check the following Kibana deployment manifest, we have a definition of ELASTICSEARCH_URL to configure the Elasticsearch cluster Endpoint. Kibana uses the Endpoint URL to connect to Elasticsearch.
Here is the definition of the kibana-deployment.yaml file.
apiVersion: apps/v1
kind: Deployment
metadata:
  name: kibana
  labels:
    app: kibana
spec:
  replicas: 1
  selector:
    matchLabels:
      app: kibana
  template:
    metadata:
      labels:
        app: kibana
    spec:
      containers:
      - name: kibana
        image: docker.elastic.co/kibana/kibana:7.5.0
        resources:
          limits:
            cpu: 1000m
          requests:
            cpu: 100m
        env:
          - name: ELASTICSEARCH_URL
            value: http://elasticsearch:9200
        ports:
        - containerPort: 5601
"state":"green","message":"Status changed from yellow to green - Ready","prevState":"yellow","prevMsg":"Waiting for Elasticsearch"
Now simply deploy Kibana:
kubectl create -f kibana-deployment.yaml
Let's create a NodePort type Service to access the Kibana UI through the node IP address. We use nodePort for demonstration. However, ideally, Kubernetes with ClusterIP services is used for actual project implementations.
The definition of the kibana-svc.yaml file is as follows:
apiVersion: v1
kind: Service
metadata:
  name: kibana-np
spec:
  selector:
    app: kibana
  type: NodePort
  ports:
    - port: 8080
      targetPort: 5601
      nodePort: 30000
Create the Kibana Service:
kubectl create -f kibana-svc.yaml
You can now access the Kibana UI via http://<node-ip>:30000.
After the Pod is running, let’s verify the Kibana deployment. The simplest way is to access the cluster's UI.
To check the status, port forward the 5601 port of the Kibana Pod. If you have already created the NodePort service, you can also use that (note that the firewall may block it).
kubectl port-forward <kibana-pod-name> 5601:5601
Then, access the UI via a web browser or use curl to issue a request:
curl http://localhost:5601/app/kibana
If the Kibana UI loads or a valid curl response appears, then we can conclude that Kibana is running correctly.
Deploy Fluentd
Fluentd is deployed as a DaemonSet because it needs to stream logs from all nodes in the cluster. In addition, it requires special permissions to list and extract Pod metadata across all namespaces.
Kubernetes service accounts are used to provide permissions for components within Kubernetes, along with cluster roles and bindings. Let’s proceed to create the required service accounts and roles.
Create Fluentd Cluster Role
Cluster roles in Kubernetes contain rules that represent a set of permissions, and for Fluentd, we want to grant permissions for Pods and namespaces.
Here is the definition of the fluentd-role.yaml file:
apiVersion: rbac.authorization.k8s.io/v1
kind: ClusterRole
metadata:
  name: fluentd
  labels:
    app: fluentd
rules:
- apiGroups:
  - ""
  resources:
  - pods
  - namespaces
  verbs:
  - get
  - list
  - watch
Create the role:
kubectl create -f fluentd-role.yaml
Create Fluentd Service Account
In Kubernetes, a Service Account is an entity that provides identities to Pods. Here, we want to create a Service Account for Fluentd Pods.
Here is the definition of the fluentd-sa.yaml file:
apiVersion: v1
kind: ServiceAccount
metadata:
  name: fluentd
  labels:
    app: fluentd
Create the Service Account:
kubectl create -f fluentd-sa.yaml
Cluster Role Binding
Cluster Role Binding in Kubernetes grants the permissions defined in a cluster role to a service account. We want to create a role binding between the role and the service account we created above.
Here is the definition of the fluentd-rb.yaml file:
kind: ClusterRoleBinding
apiVersion: rbac.authorization.k8s.io/v1
metadata:
  name: fluentd
roleRef:
  kind: ClusterRole
  name: fluentd
  apiGroup: rbac.authorization.k8s.io
subjects:
- kind: ServiceAccount
  name: fluentd
  namespace: default
Create the role binding:
kubectl create -f fluentd-rb.yaml
Deploy Fluentd DaemonSet
Now let's deploy Fluentd:
kubectl create -f fluentd-ds.yaml
To verify the installation of Fluentd, let’s start a Pod that continuously creates logs. Then we will try to see if these logs are picked up and stored in Elasticsearch within Kibana.
kubectl create -f test-pod.yaml
Now, let’s head to Kibana to check if the logs from this pod have been picked up by Fluentd and stored in Elasticsearch. Follow these steps:
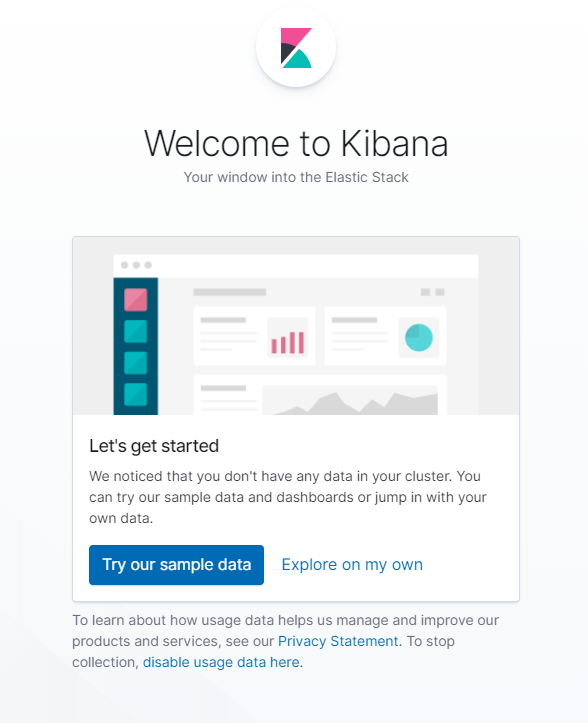
- Click
explore on my ownto enter the backend.
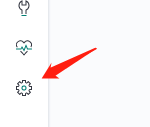
- Select the “Index Patterns” option under the Kibana section.
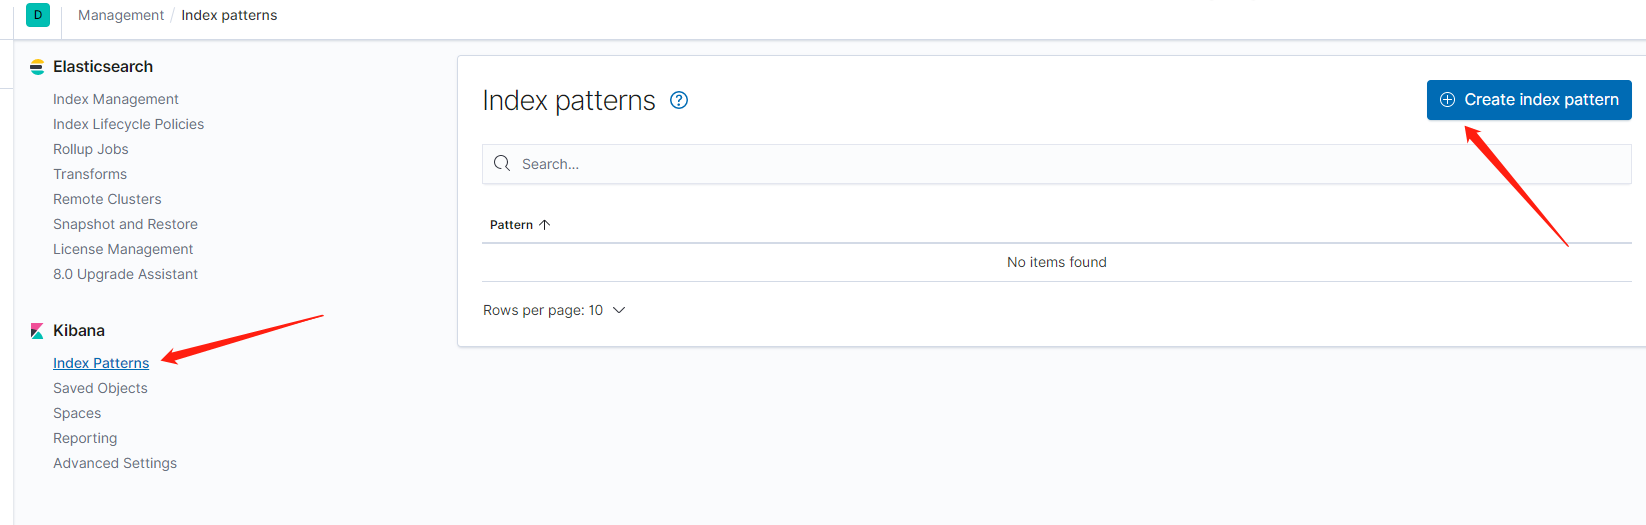
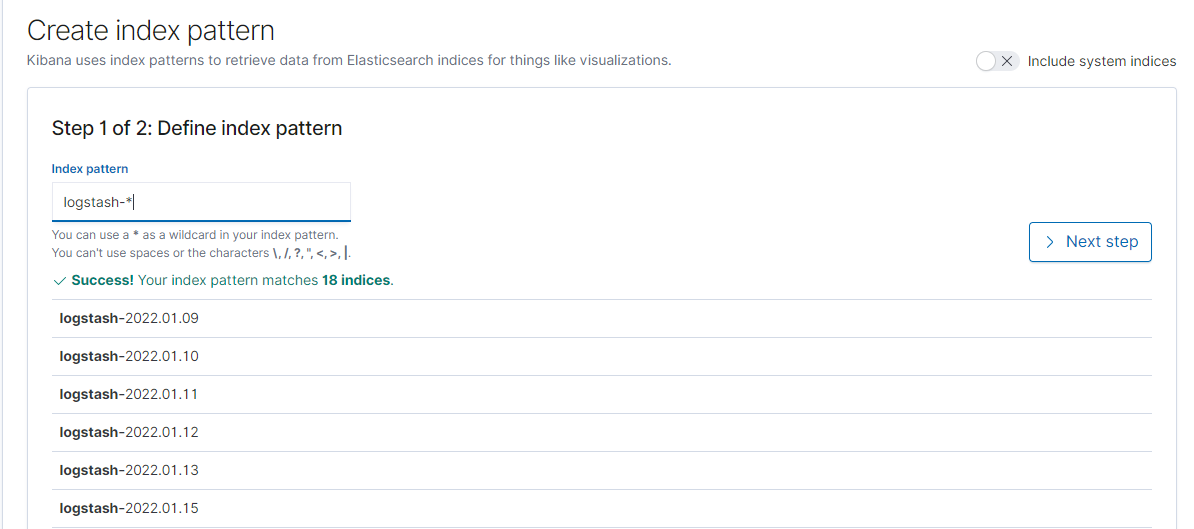
- Create a new Index Pattern using
logstash-*, then clickNext step.
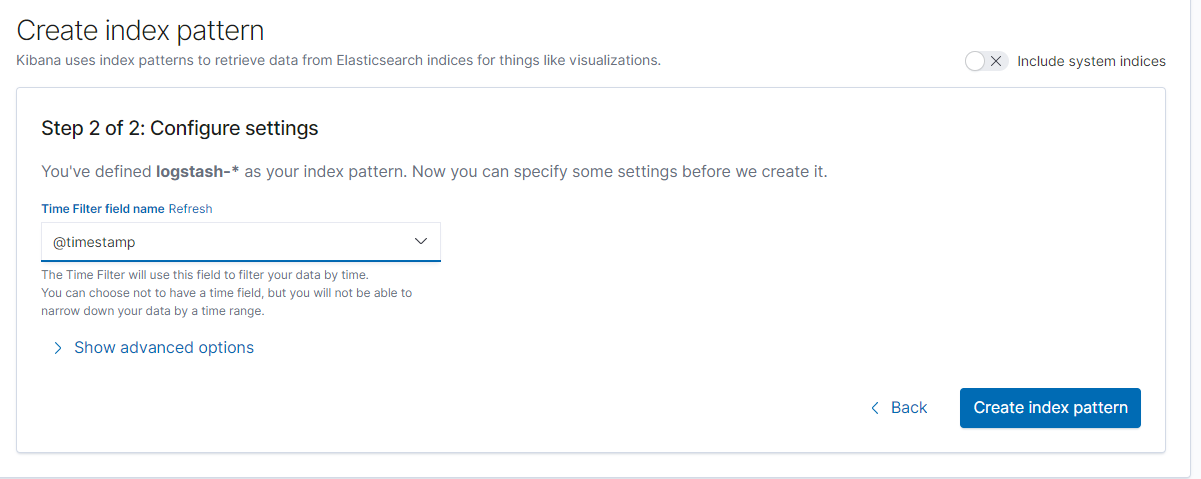
- Find the
@timestampoption, then clickCreate index pattern.
Now that the index pattern has been created, we can go to the console, where you will be able to see all the logs exported by Fluentd, originating from our test-pod, as shown below.
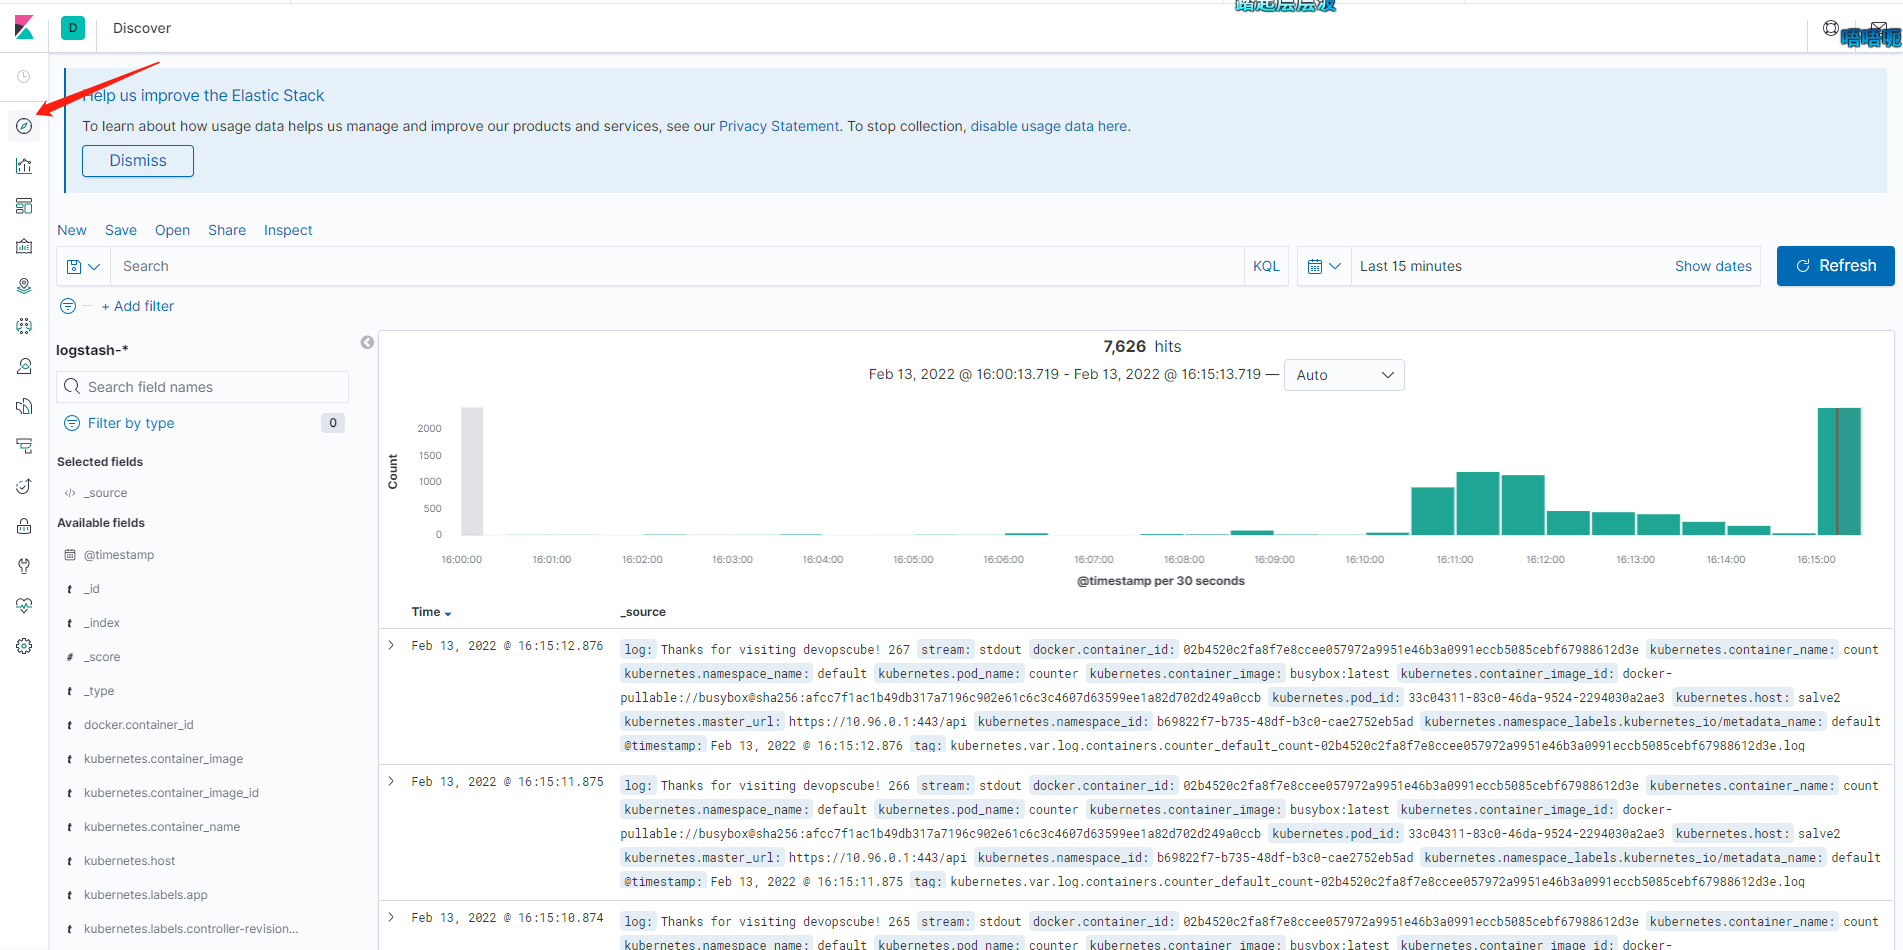
Next, readers can continue to delve into chart creation and log analysis based on the official documentation or other resources to apply the EFK stack in production.
If you want to delve deeper into the Kibana panel, the author recommends reading this blog: https://devopscube.com/kibana-dashboard-tutorial/

文章评论