本教程已加入 Istio 系列:https://istio.whuanle.cn
Observability
Istio integrates tracing applications such as Jaeger, Zipkin, and Skywalking, effectively capturing the structure of the service mesh, presenting the network topology, and analyzing the health of the mesh.
This is all made possible by the implementation of the Envoy proxy. As all incoming and outgoing traffic must pass through the Envoy proxy, Envoy can capture these traffic records and push them to the corresponding tracing systems. This allows tracing systems to easily monitor and analyze traffic conditions within the service mesh.
Additionally, Istio supports Prometheus and Grafana for collecting metric data.
Below we will deploy Kiali and Jaeger using the official templates and then view the cluster's metric information uniformly through Kiali.
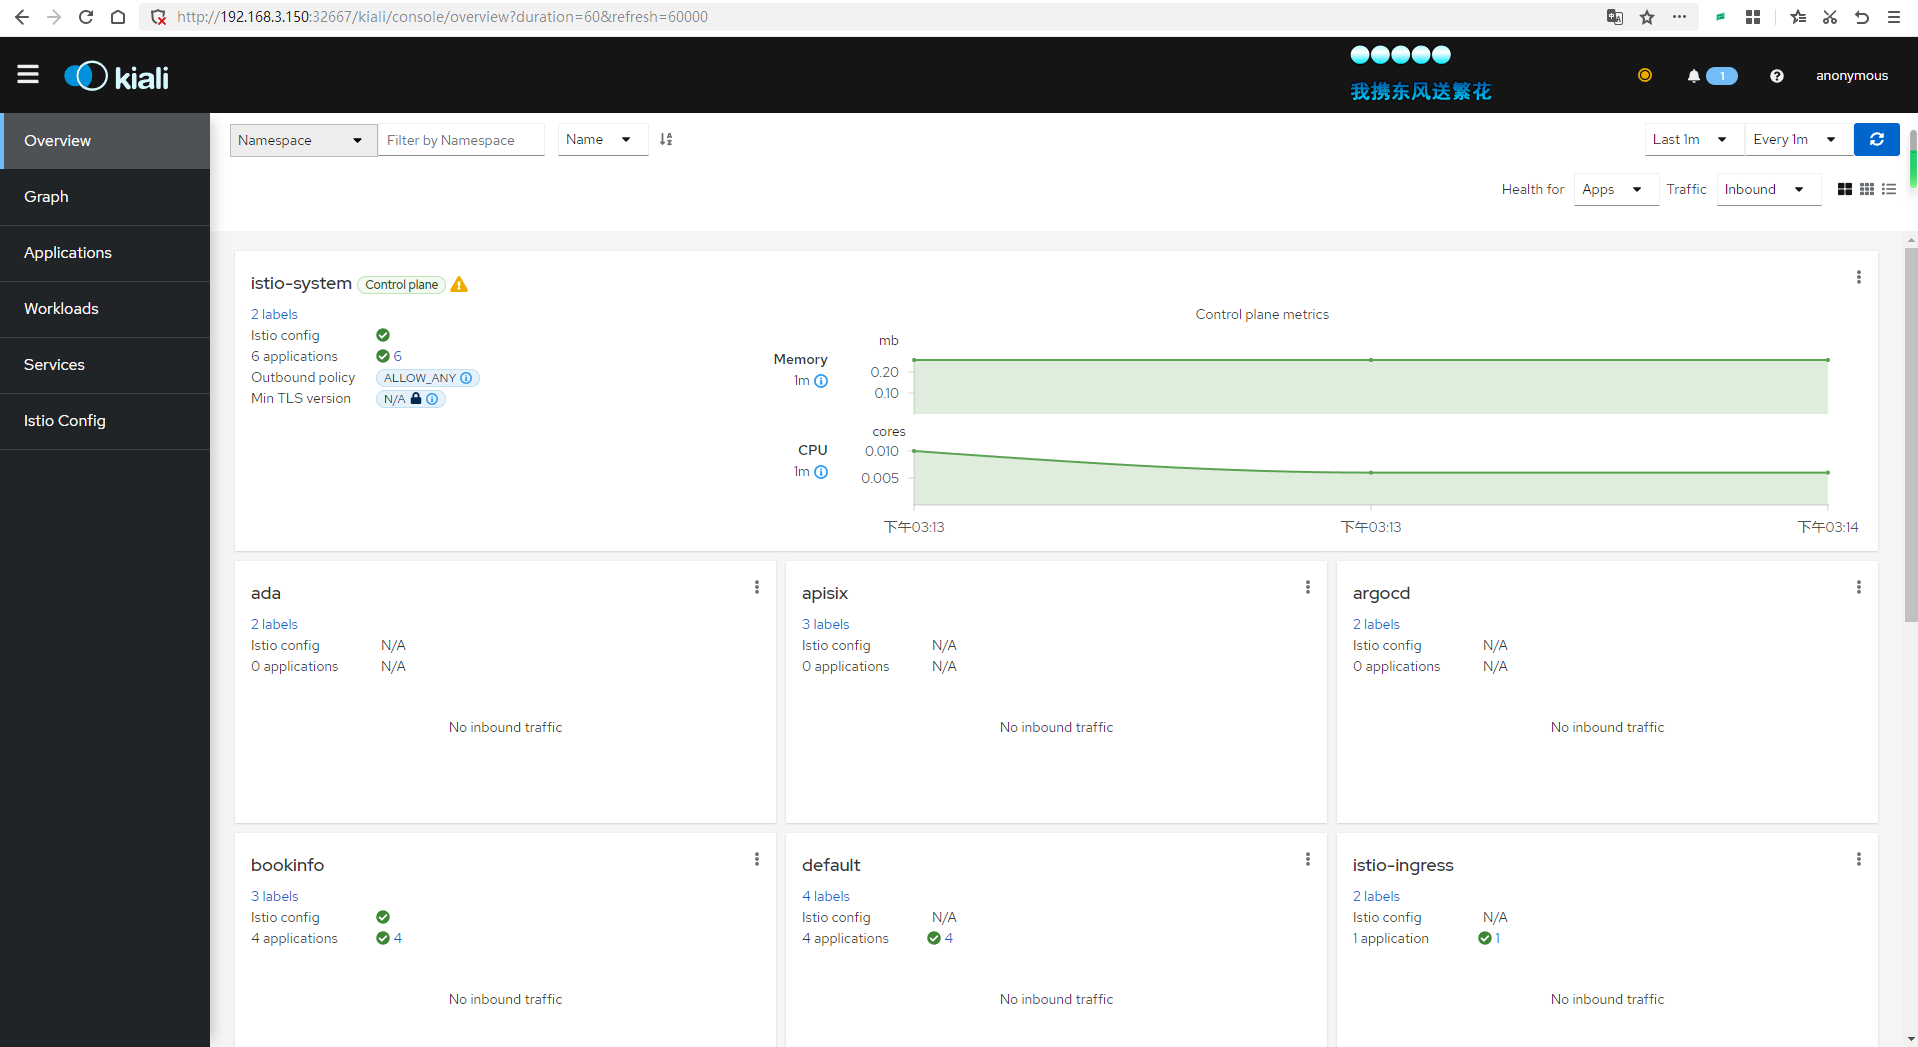
Kiali Interface Example:
Pull the official Istio repository:
git clone https://github.com/istio/istio.git
In the samples/addons/ directory, there are the following directories or files:
samples/addons/
├── extras
│   ├── prometheus-operator.yaml
│   ├── prometheus_vm_tls.yaml
│   ├── prometheus_vm.yaml
│   ├── skywalking.yaml
│   └── zipkin.yaml
├── grafana.yaml
├── jaeger.yaml
├── kiali.yaml
├── prometheus.yaml
└── README.md
We will enable the four files: grafana.yaml, jaeger.yaml, kiali.yaml, and prometheus.yaml.
kubectl apply -f samples/addons
These services are installed by default in the istio-system namespace, so no additional setup is required.
Istio uses Jaeger for tracing by default, and we can also use Skywalking for tracing. The configurations in the extras directory can be deployed by ourselves.
Execute the command to check the corresponding IP and port of its Service:
kubectl get svc -n istio-system
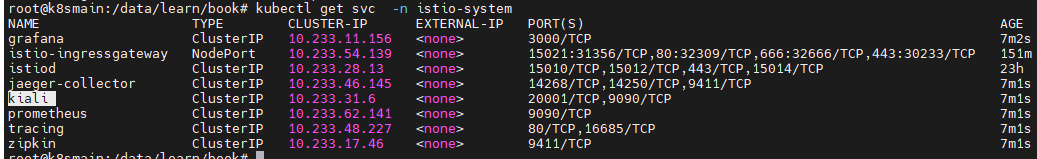
Now, we have two ways for Kiali to be accessed externally. One is to modify the Service configuration and change its access type to NodePort, and the other is to use the istio-ingressgateway to configure traffic entry.
The second method is relatively complicated, but to validate our learning results, we might as well use the Gateway method to expose the service.
Access Kiali via Gateway
First, create a Gateway.
kiali_gateway.yaml
apiVersion: networking.istio.io/v1alpha3
kind: Gateway
metadata:
  name: kiali-gateway
spec:
  selector:
    istio: ingressgateway
  servers:
  - port:
      number: 15029
      name: http-kiali
      protocol: HTTP
    hosts:
    - "*"
kubectl -n istio-system apply -f kiali_gateway.yaml
Next, create a VirtualService resource to route the Gateway to the Kiali service.
kiali_vs.yaml
apiVersion: networking.istio.io/v1alpha3
kind: VirtualService
metadata:
  name: kiali
spec:
  hosts:
  - "*"
  gateways:
  - kiali-gateway
  http:
  - match:
    - uri:
        prefix: /kiali
    route:
    - destination:
        host: kiali.istio-system.svc.cluster.local
        port:
          number: 20001
kubectl -n istio-system apply -f kiali_vs.yaml
Then modify the istio-ingressgateway to add a configuration to expose the Kiali service.
kubectl edit svc istio-ingressgateway -n istio-system
  - name: kiali
    nodePort: 32667
    port: 15029
    protocol: TCP
    targetPort: 15029
Then visit: http://192.168.3.150:32667/kiali
View Tracing Data
Now we will execute a command in the Shell to poll the previously deployed microservices for a while to create traffic to the cluster.
for i in `seq 1 1000`; do curl -s -o /dev/null http://192.168.3.150:30666/productpage; done

Since the default tracing sampling rate is 1%, we can set the number of requests higher.
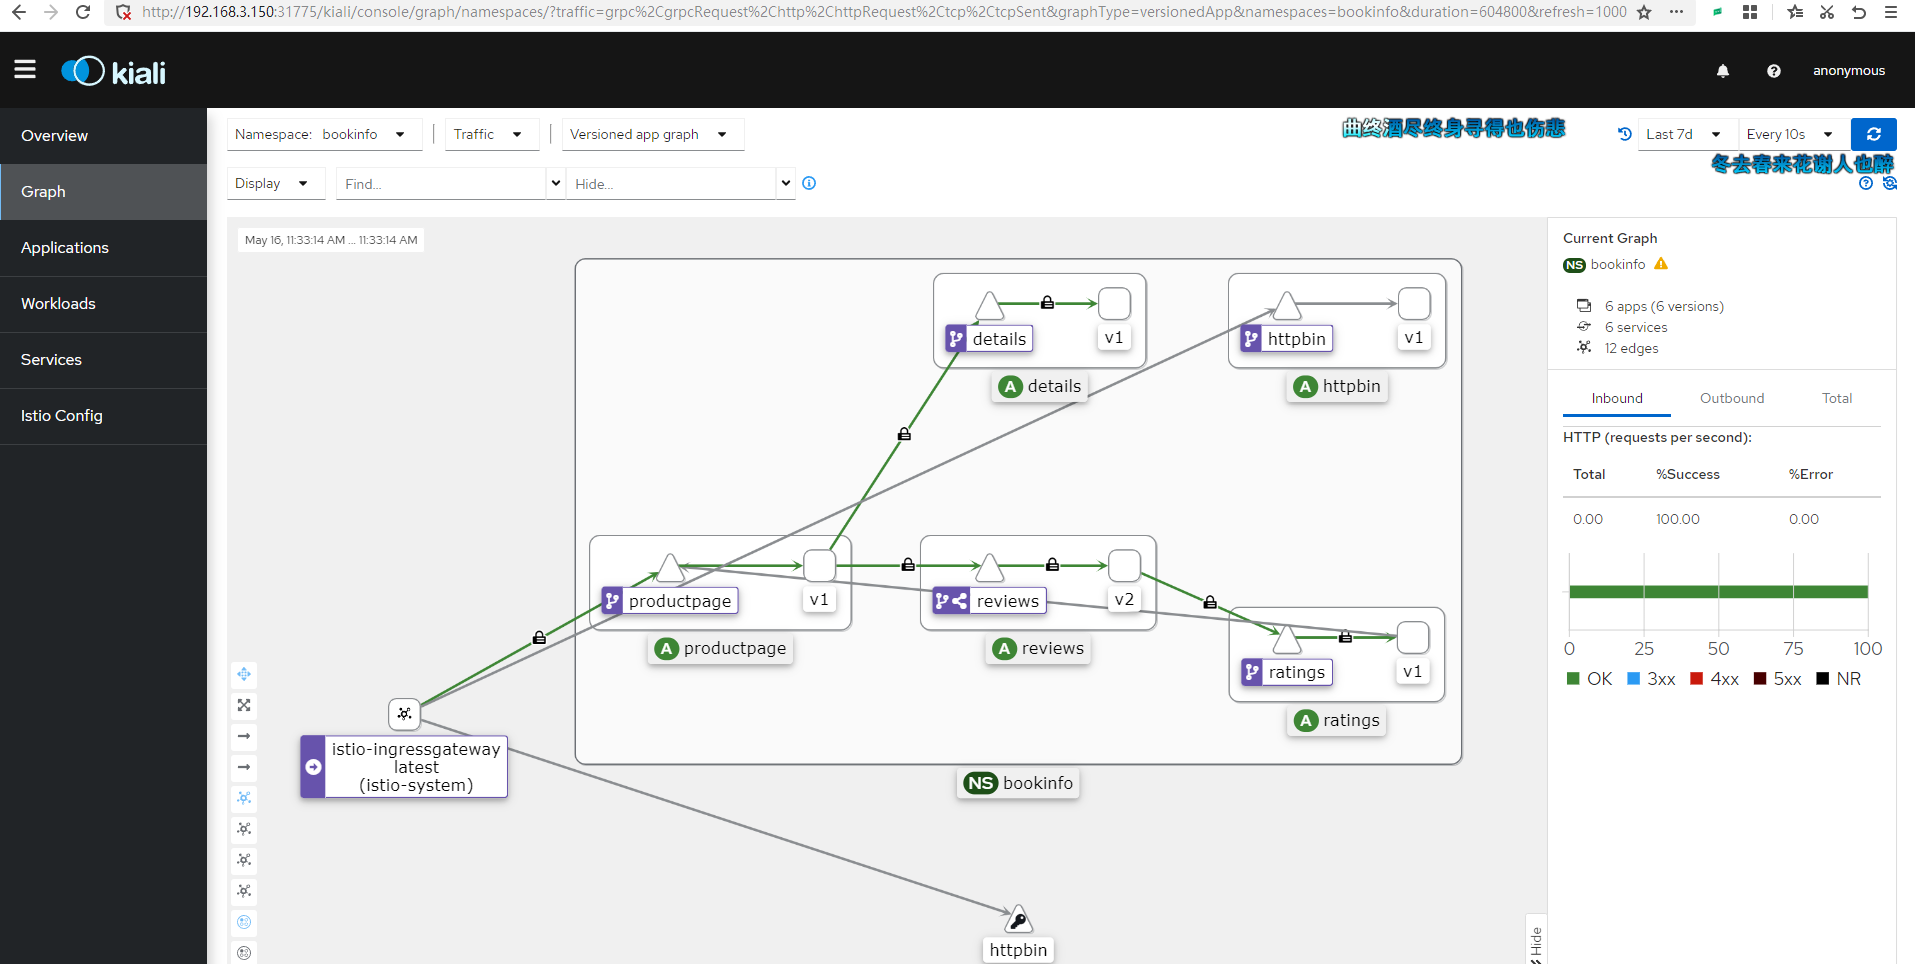
Ultimately, you will see an image similar to this.
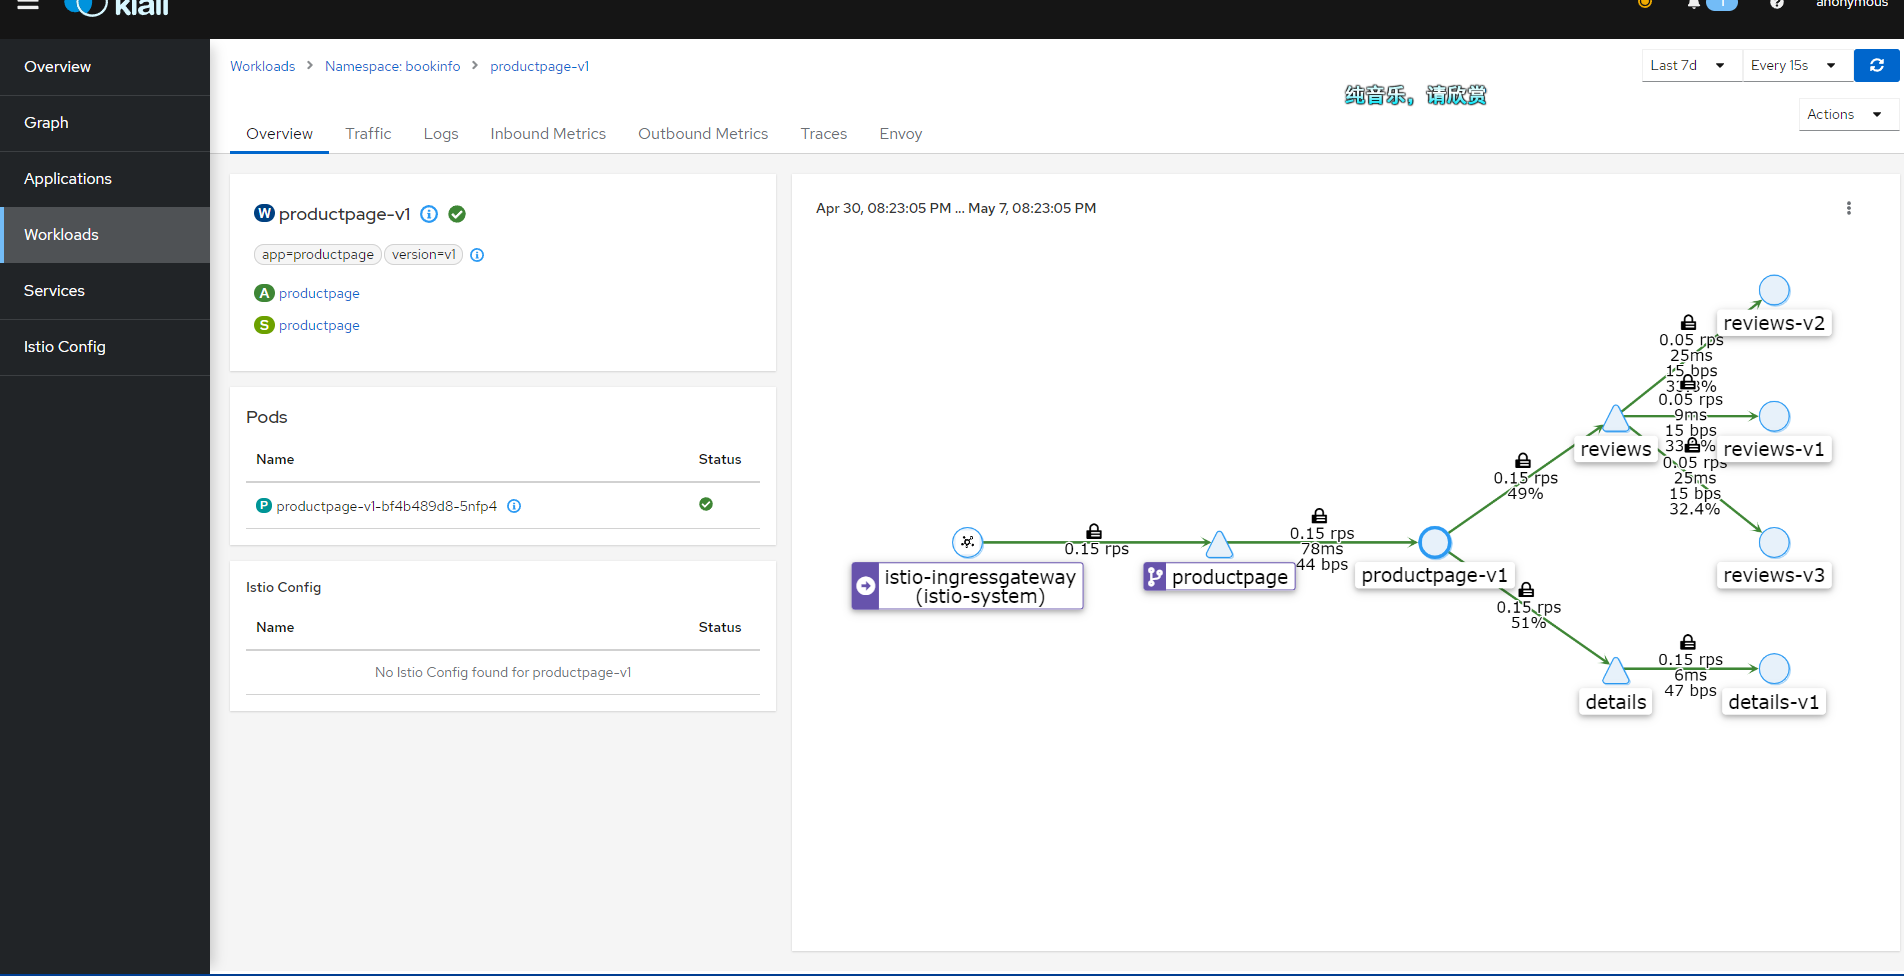
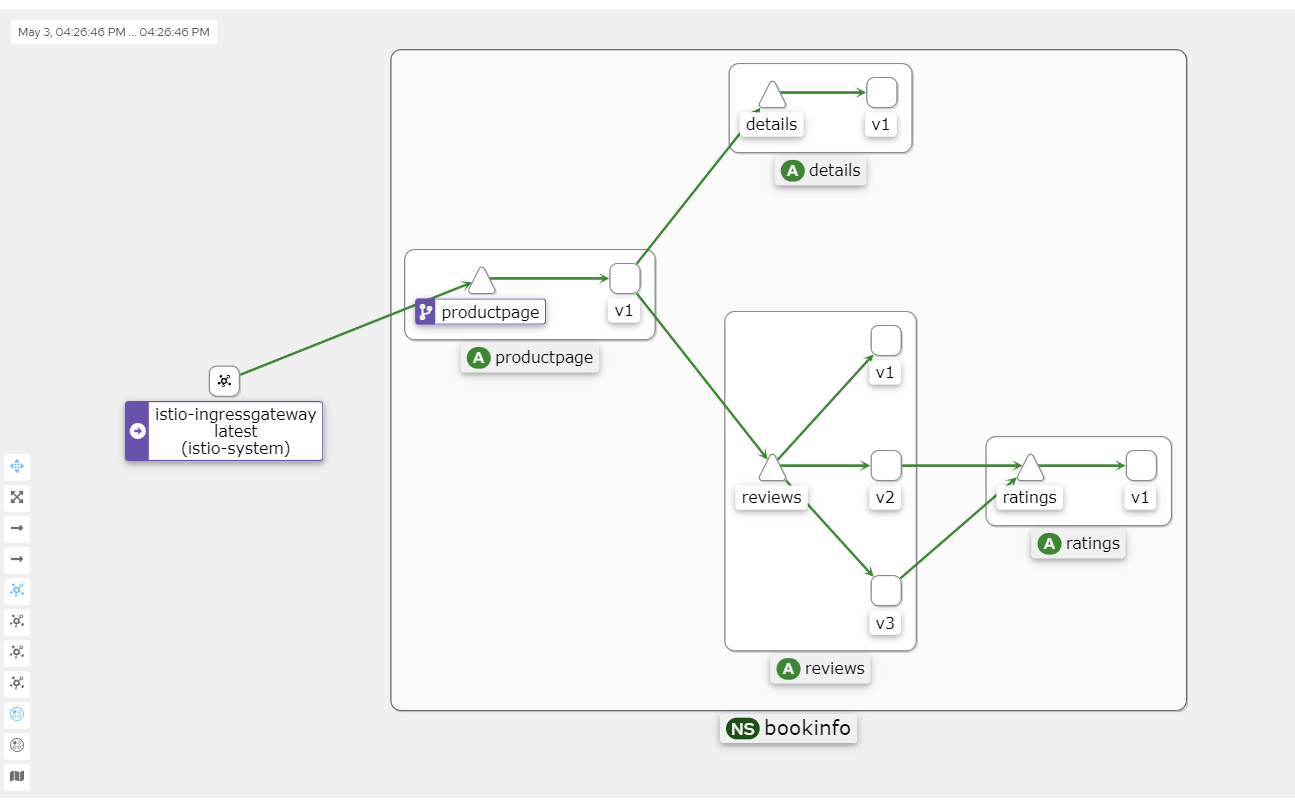
Kiali's Graph data primarily comes from two sources: Prometheus and Istio's own telemetry data.
Prometheus: Prometheus is an open-source monitoring and alerting toolkit that collects and stores metric data from the Istio service mesh. Istio uses the Envoy proxy to gather telemetry data, which is then scraped and stored by Prometheus. Kiali uses this Prometheus data to generate metrics such as traffic between services, error rates, and latency.
Istio Telemetry Data: The telemetry data generated by the Istio service mesh includes requests, responses, latencies, and other performance metrics from the Envoy proxy. This data is generated by Istio components (e.g., Mixer and Pilot) and the Envoy proxy itself. Kiali extracts service topology information from this telemetry data to create dependency graphs between services.
Kiali integrates information from these two data sources to generate a Graph that illustrates the topology of the service mesh, traffic between services, and other performance metrics. This helps users better understand the dependencies between services, identify potential performance issues, and optimize service mesh configurations.
Possible Reasons for Failure
If your Kiali continuously shows an Empty Graph, please check the following possible situations:
- The cluster version is below 1.23, and you need to upgrade your Kubernetes cluster.
- If Kubesphere is installed, it may lead to issues; Kubesphere is quite heavy, and the author spent an entire night reinstalling the cluster.
- The access address being used is incorrect; the access to
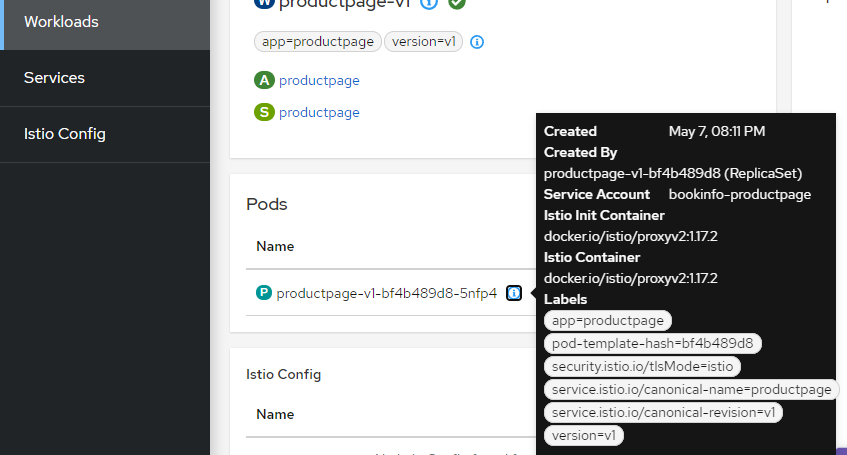
/productpageis not configured, and traffic is not entering the cluster. - Pods are not injected with istio-proxy.
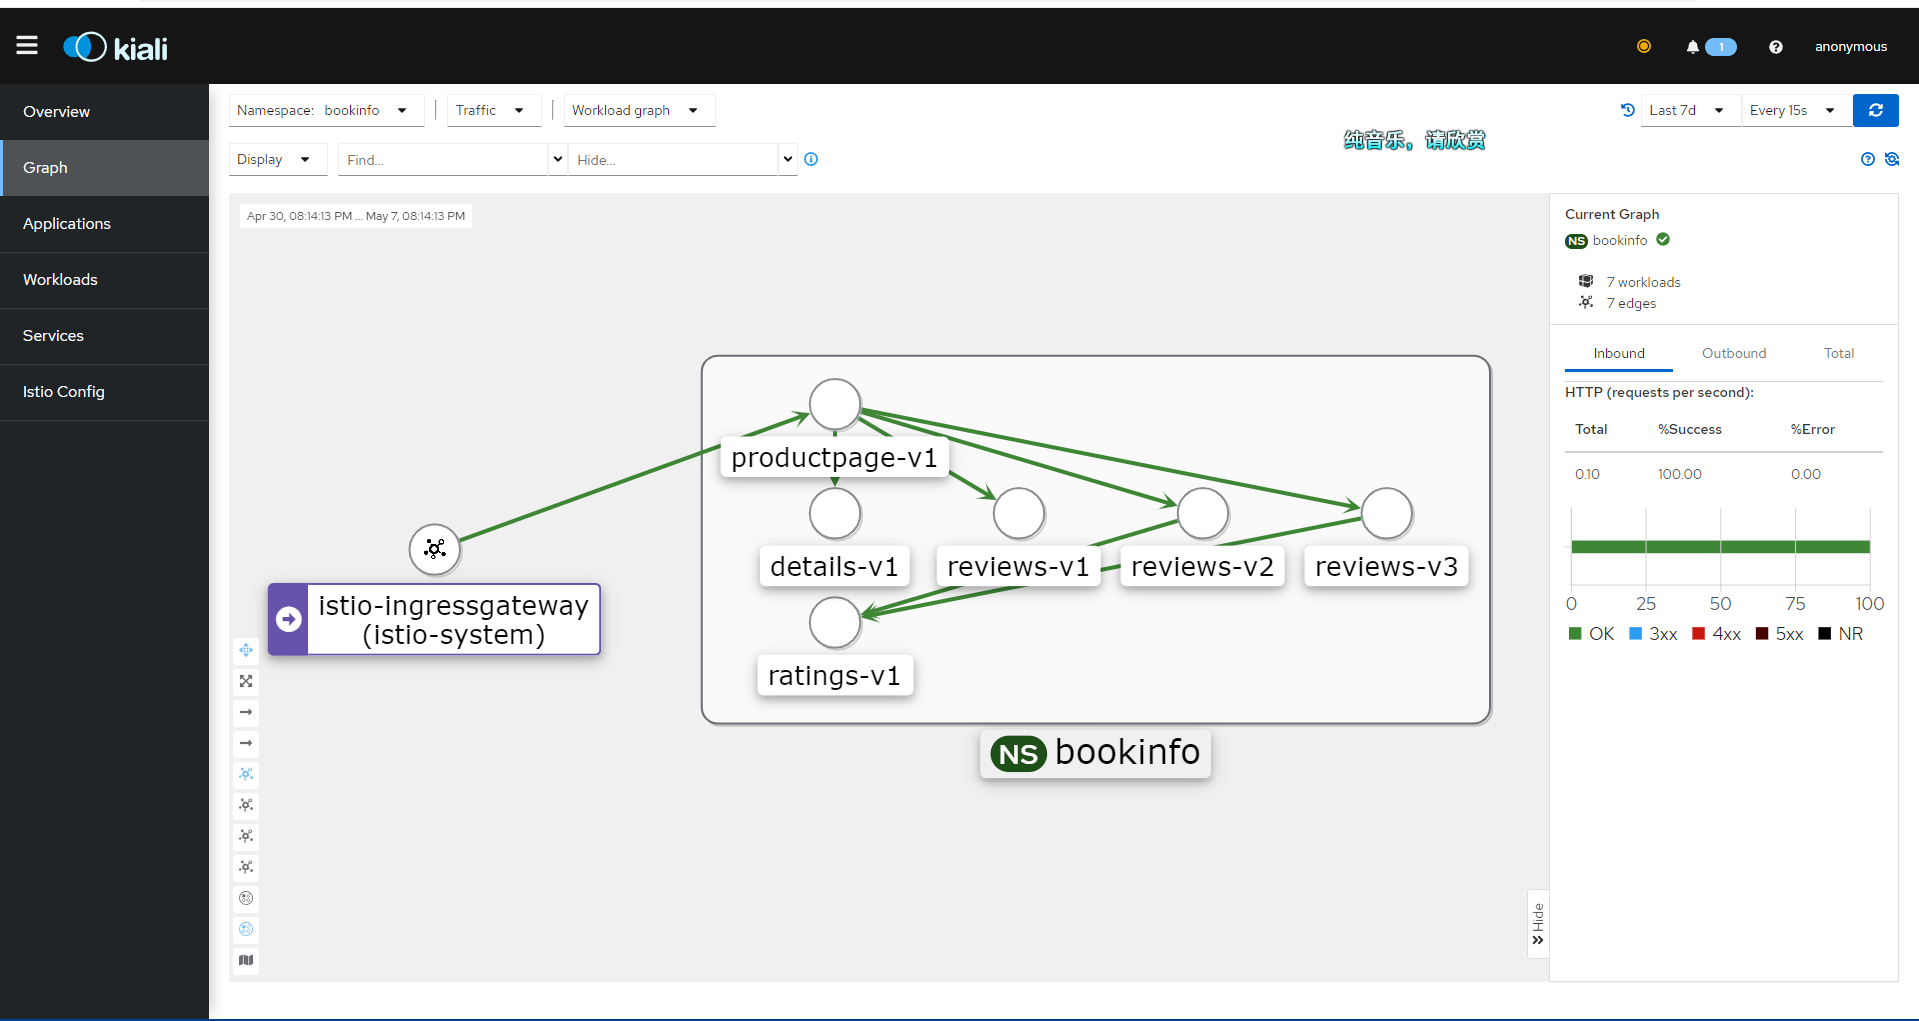
You can check the Pod information of each workload in Kiali’s Workloads, which should look as follows under normal conditions:
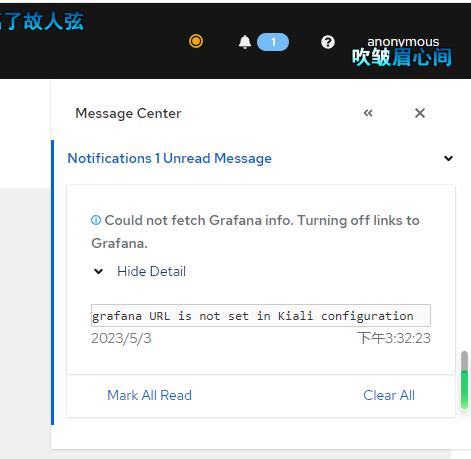
Fixing Kiali Grafana Issues
Clicking the message in the upper right corner may indicate that the configuration is incorrect because Kiali needs to pull data from Grafana.
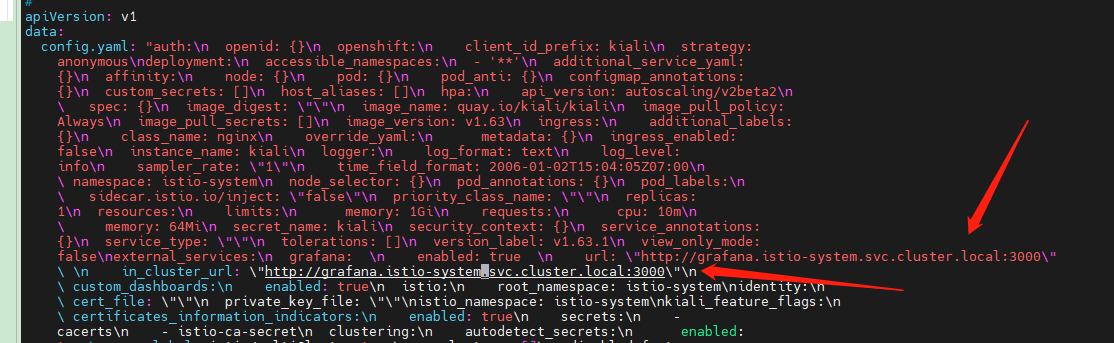
Edit the configmap.
kubectl edit configmap kiali -n istio-system
Add the following two lines to it.
  grafana:
    enabled: true
    url: "http://grafana.istio-system.svc.cluster.local:3000"
    in_cluster_url: "http://grafana.istio-system.svc.cluster.local:3000"
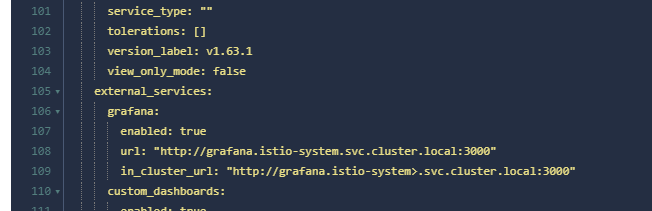
If you are using a visual tool, the addition will be simple.
      grafana:
        enabled: true
        url: "http://grafana.istio-system.svc.cluster.local:3000"
        in_cluster_url: "http://grafana.istio-system.svc.cluster.local:3000"
Then use kubectl describe configmap kiali -n istio-system to check if the configuration is correct.

文章评论