本教程已加入 Istio 系列:https://istio.whuanle.cn
Observability
Istio integrates link tracing applications such as Jaeger, Zipkin, and Skywalking, effectively capturing the structure of the service mesh, displaying the network topology, and analyzing the health of the mesh.
This is all thanks to the implementation of the Envoy proxy. Since all incoming and outgoing traffic must pass through the Envoy proxy, it can capture these traffic records and push them to the appropriate link tracing systems. This allows the link tracing system to easily monitor and analyze traffic conditions within the service mesh.
Additionally, Istio also supports Prometheus and Grafana for collecting metric data.
Next, we will deploy Kiali and Jaeger using the official template, and then view the cluster's metric information uniformly through Kiali.
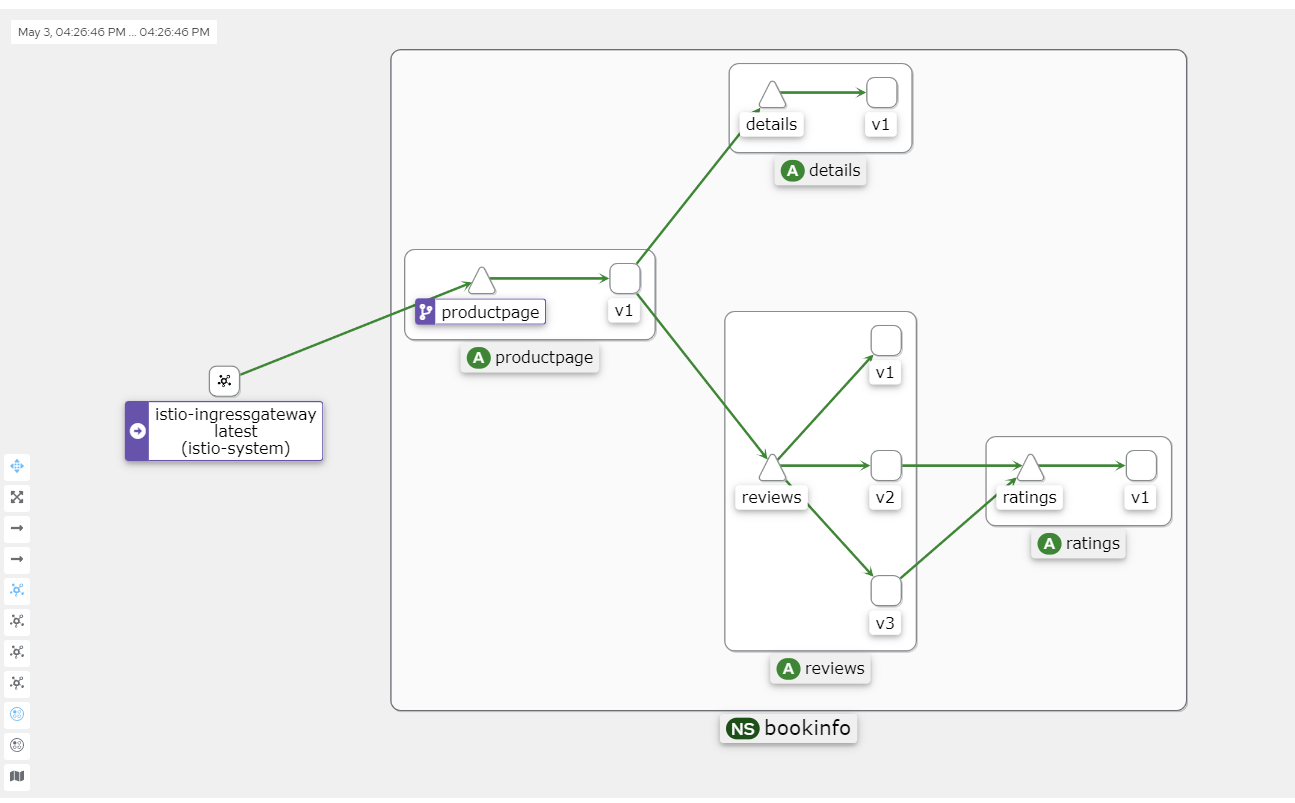
Kiali interface example:
Clone the official Istio repository:
git clone https://github.com/istio/istio.git
In the samples/addons/ directory, there are the following directories or files:
samples/addons/
├── extras
│   ├── prometheus-operator.yaml
│   ├── prometheus_vm_tls.yaml
│   ├── prometheus_vm.yaml
│   ├── skywalking.yaml
│   └── zipkin.yaml
├── grafana.yaml
├── jaeger.yaml
├── kiali.yaml
├── prometheus.yaml
└── README.md
We will enable the four files: grafana.yaml, jaeger.yaml, kiali.yaml, and prometheus.yaml.
kubectl apply -f samples/addons
These services are installed by default in the istio-system namespace, so there is no need for manual setup.
Istio uses Jaeger for link tracing by default, but we can also use Skywalking for tracing. The configurations in the extras directory can be deployed by ourselves.
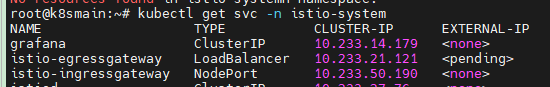
Execute the command to view the corresponding IP and port of its Service:
kubectl get svc -n istio-system
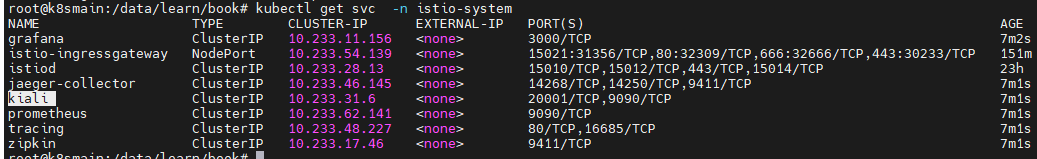
Now, we have two ways to make Kiali accessible externally. One is to modify the Service configuration and change its access type to NodePort, and the other is to configure the traffic ingress using istio-ingressgateway.
The second method is relatively cumbersome, but to validate our learning outcomes, we might as well expose the service using the Gateway approach.
Accessing Kiali via Gateway
First, create a Gateway.
kiali_gateway.yaml
apiVersion: networking.istio.io/v1alpha3
kind: Gateway
metadata:
  name: kiali-gateway
spec:
  selector:
    istio: ingressgateway
  servers:
  - port:
      number: 15029
      name: http-kiali
      protocol: HTTP
    hosts:
    - "*"
kubectl -n istio-system apply -f kiali_gateway.yaml
Next, create a VirtualService resource to route the Gateway to the Kiali service.
kiali_vs.yaml
apiVersion: networking.istio.io/v1alpha3
kind: VirtualService
metadata:
  name: kiali
spec:
  hosts:
  - "*"
  gateways:
  - kiali-gateway
  http:
  - match:
    - uri:
        prefix: /kiali
    route:
    - destination:
        host: kiali.istio-system.svc.cluster.local
        port:
          number: 20001
kubectl -n istio-system apply -f kiali_vs.yaml
Then modify the istio-ingressgateway to add a configuration to expose the service for Kiali.
kubectl edit svc istio-ingressgateway -n istio-system
  - name: kiali
    nodePort: 32667
    port: 15029
    protocol: TCP
    targetPort: 15029
Then access: http://192.168.3.150:32667/kiali
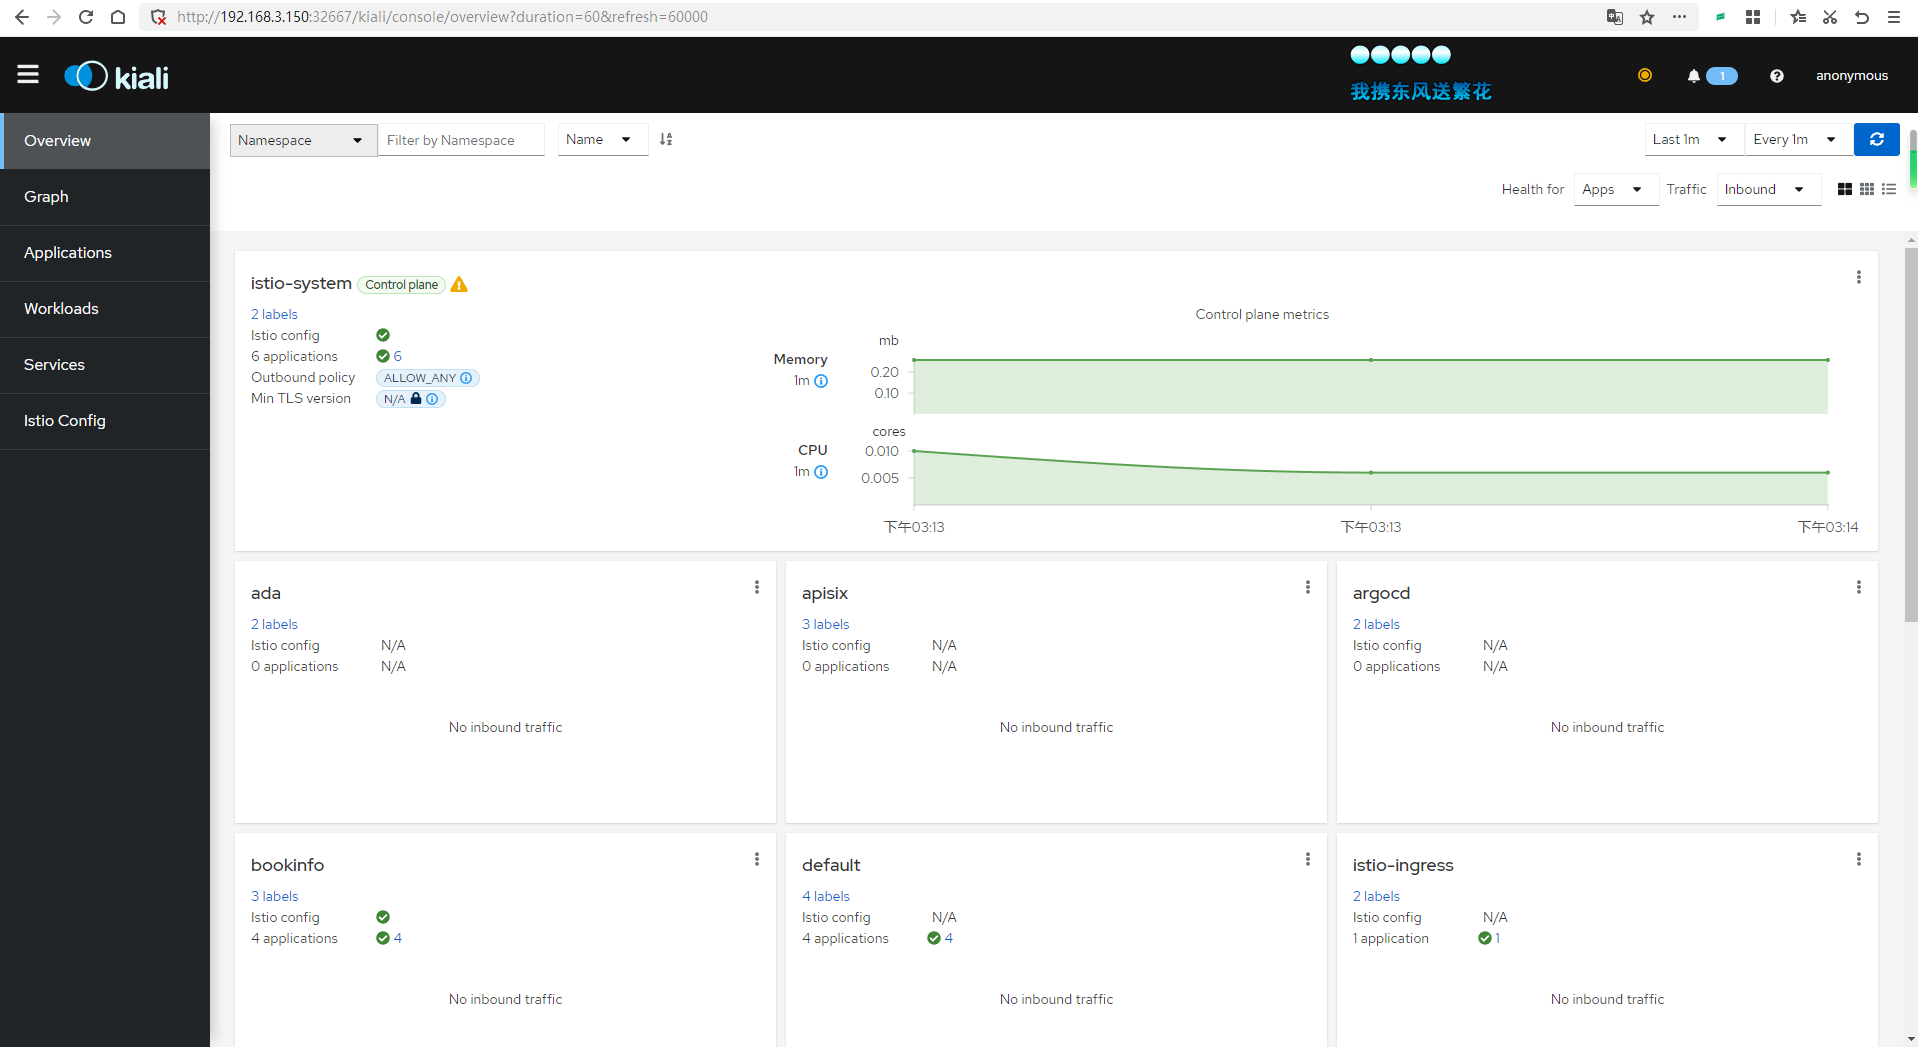
Viewing Link Tracing Data
Now we will execute a command in the Shell to poll the previously deployed microservices for a while to create access traffic for the cluster.
for i in `seq 1 1000`; do curl -s -o /dev/null http://192.168.3.150:30666/productpage; done

Because the default link tracing sampling rate is 1%, the number of requests can be set larger.
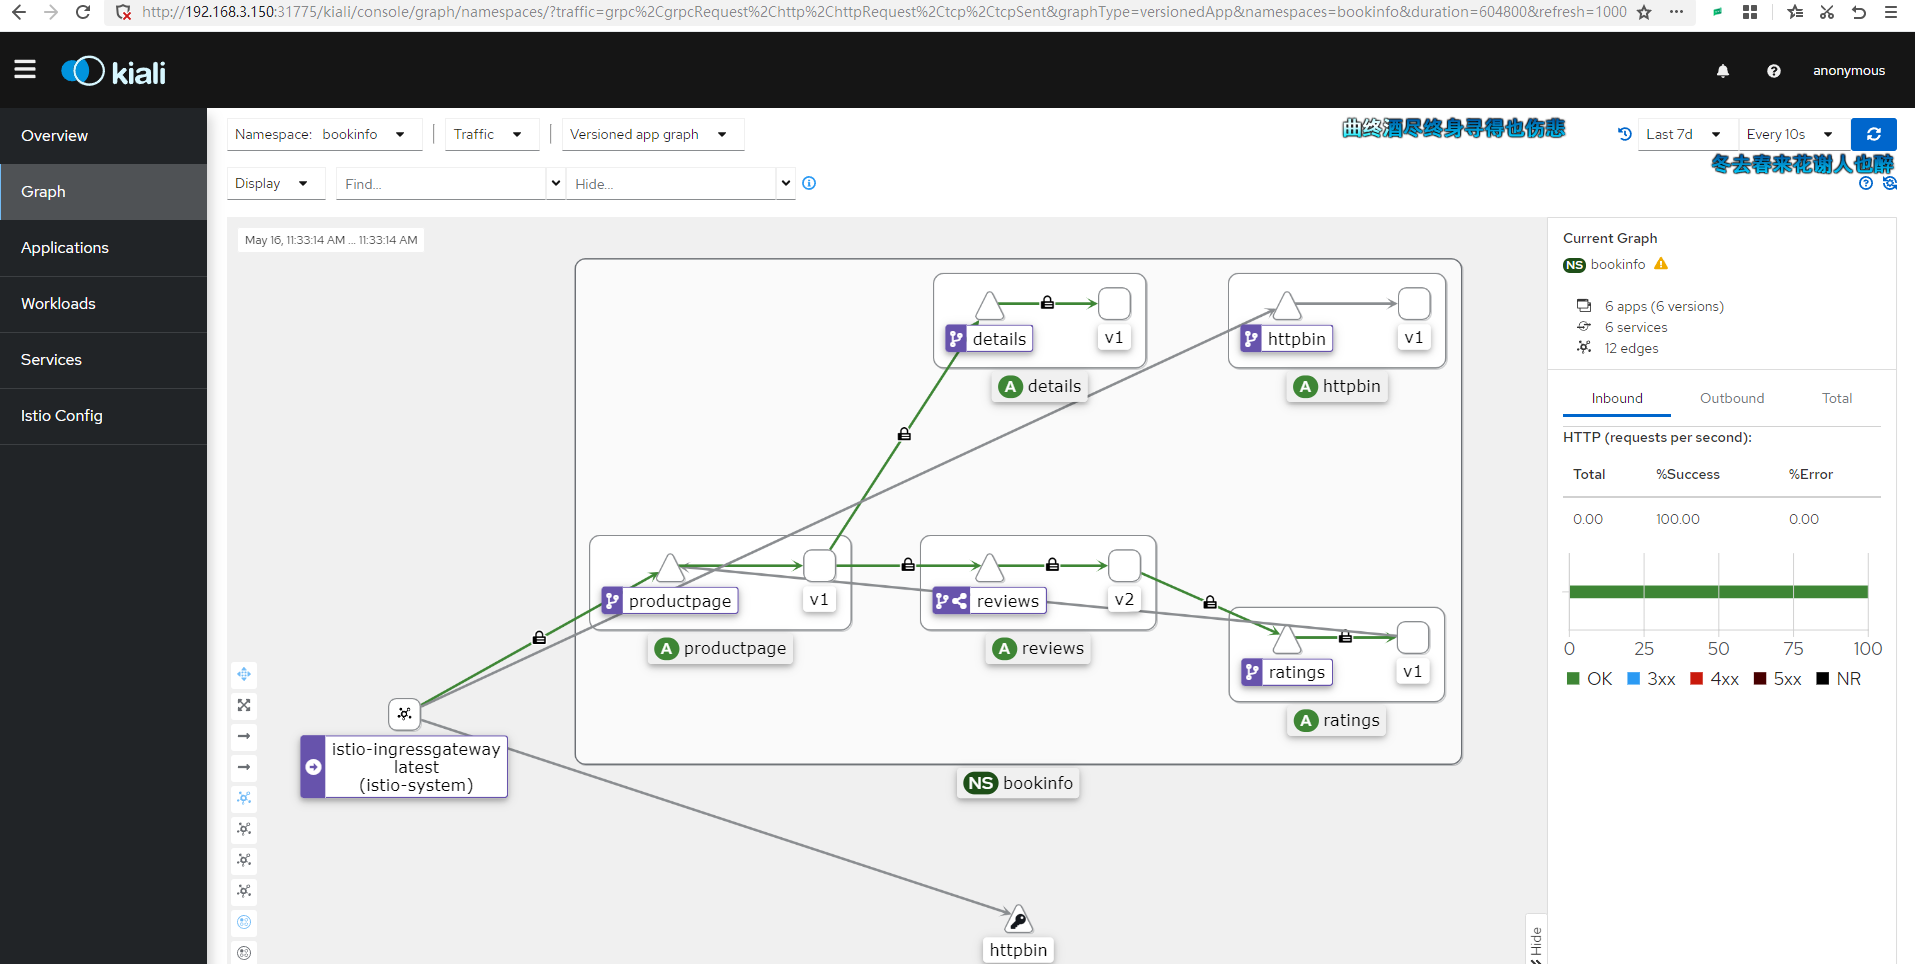
Eventually, you will get an image similar to this.
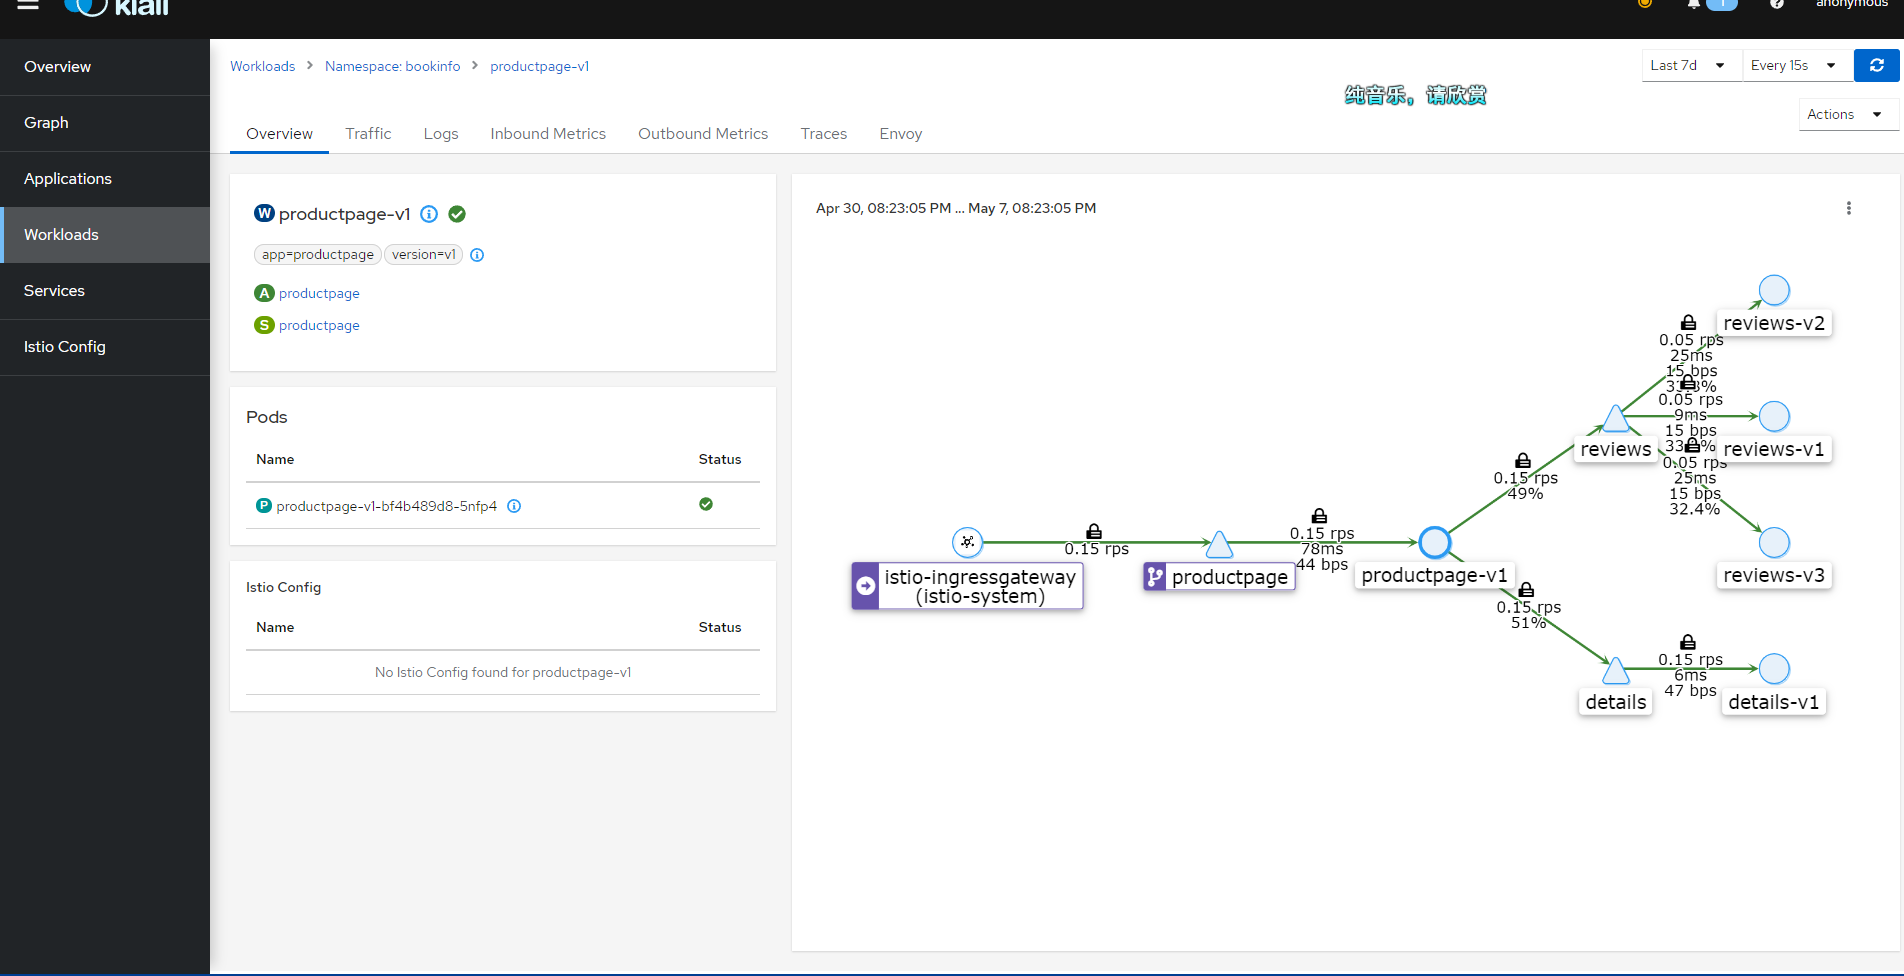
Kiali's Graph data mainly comes from two sources: Prometheus and Istio's telemetry data.
Prometheus: Prometheus is an open-source monitoring and alerting tool used to collect and store metric data within the Istio service mesh. Istio uses the Envoy proxy to collect telemetry data, which is then scraped and stored by Prometheus. Kiali uses this Prometheus data to generate metrics such as traffic between services, error rates, and latency.
Istio Telemetry Data: The telemetry data generated by the Istio service mesh includes requests, responses, latencies, and other performance metrics from the Envoy proxy. This data is produced by Istio components (such as Mixer and Pilot) as well as the Envoy proxy itself. Kiali obtains service topology information from this telemetry data to create dependency graphs between services.
Kiali integrates information from these two data sources to generate Graph, which displays the topology of the service mesh, traffic between services, and other performance metrics. This helps users better understand the dependencies between services, identify potential performance issues, and optimize service mesh configurations.
Possible Causes of Failure
If your Kiali keeps showing an Empty Graph, please pay attention to the following potential issues:
- The cluster version is below 1.23, and you need to upgrade the Kubernetes cluster.
- If Kubesphere is installed, it can cause issues due to the heavy overhead; the author spent a whole night reinstalling the cluster.
- The access address is incorrect, as there is no configuration for accessing
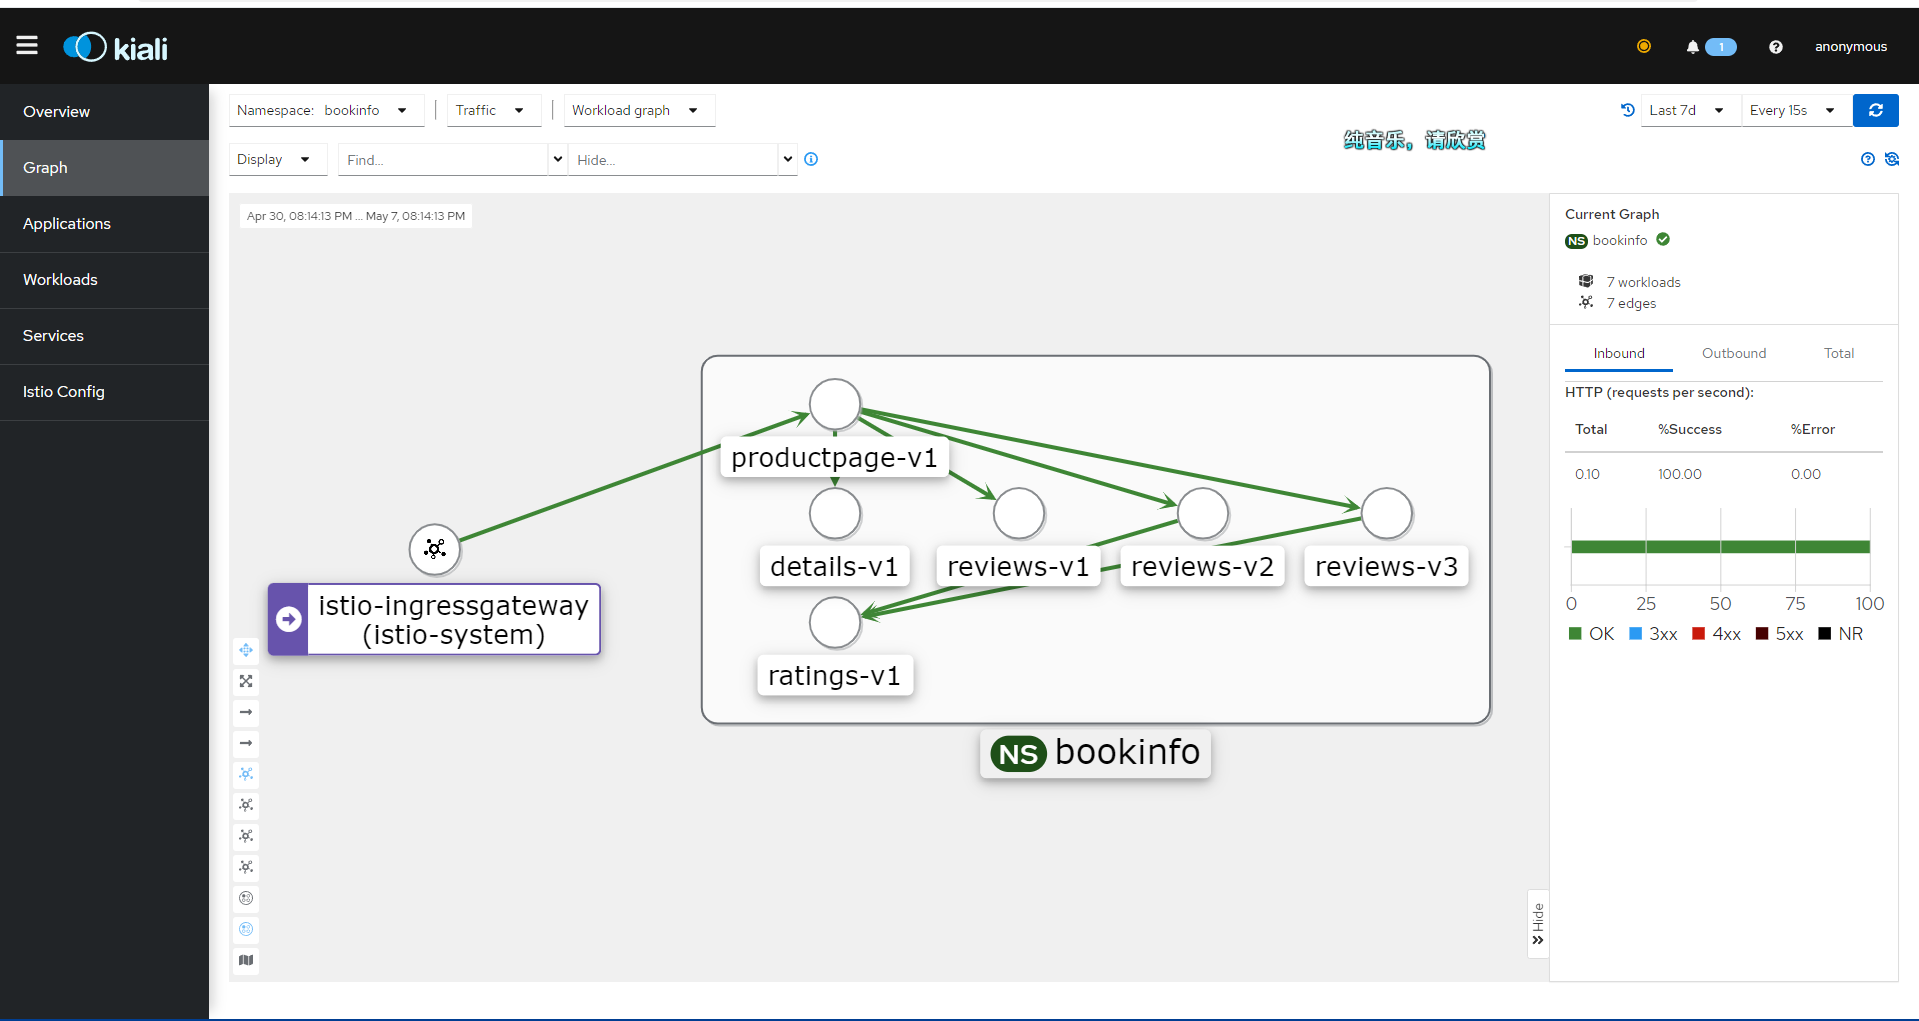
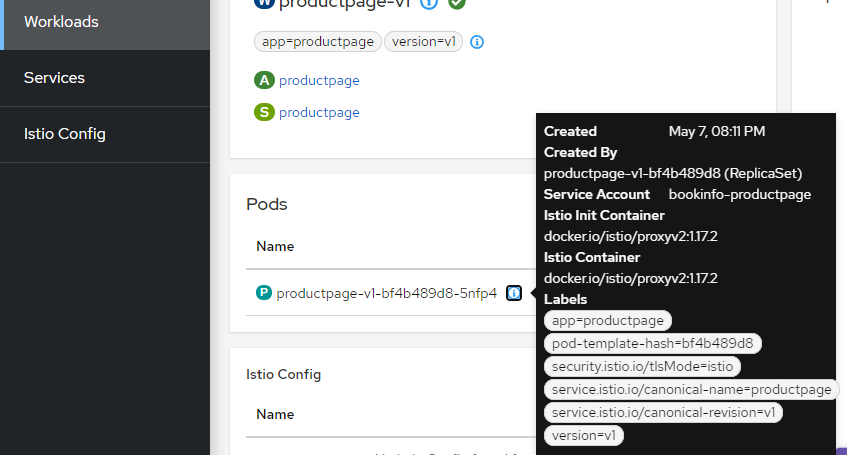
/productpage, resulting in no traffic entering the cluster. - Pods are not injected with istio-proxy.
You can check the Pod information of each workload in Kiali's Workloads, which should normally look as follows:
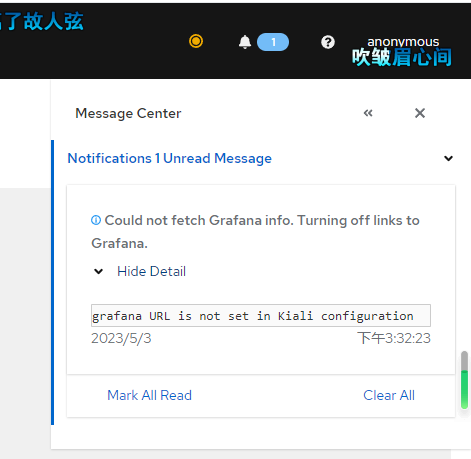
Fixing Kiali Grafana Issues
Click on the message in the upper right corner, which may indicate misconfiguration, as Kiali needs to pull data from Grafana.
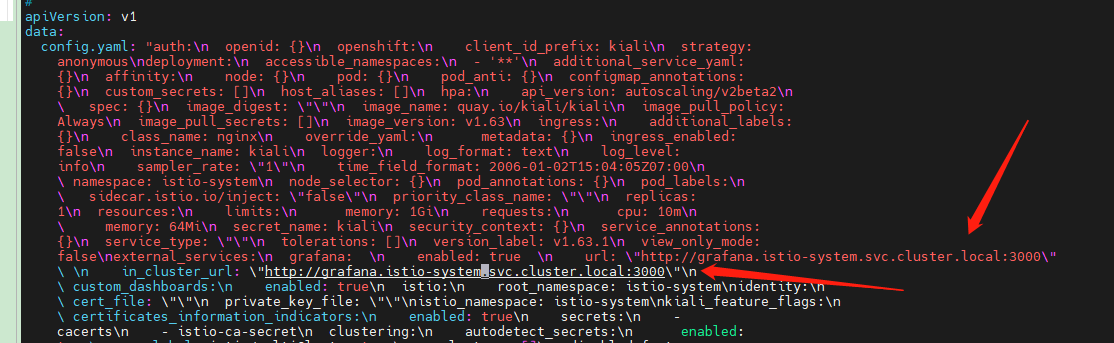
Edit the configmap.
kubectl edit configmap kiali -n istio-system
Add the following two lines inside.
  grafana:
    enabled: true
    url: "http://grafana.istio-system.svc.cluster.local:3000"
    in_cluster_url: "http://grafana.istio-system.svc.cluster.local:3000"
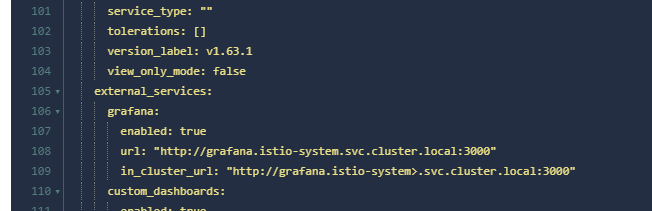
If you are using a visual tool, adding is simpler.
      grafana:
        enabled: true
        url: "http://grafana.istio-system.svc.cluster.local:3000"
        in_cluster_url: "http://grafana.istio-system.svc.cluster.local:3000"
Then check whether the configuration is correct using kubectl describe configmap kiali -n istio-system.
5. Ingress and Egress Gateways
Istio can manage ingress and egress traffic for the cluster. When a client accesses an application within the cluster, Istio can load balance and implement circuit breaking and other functions for the traffic passing through the istio-ingressgateway.
However, if an application within the cluster needs to access google.com, can we configure load balancing for all internal requests to google.com? The answer is yes; Istio provides istio-egressgateway to achieve this. Because when a container in a Pod tries to access the network, it will be intercepted by Envoy, which can easily analyze these requests and then influence the behavior of the requests through a series of means.
In this chapter, we will briefly discuss istio-ingressgateway and istio-egressgateway.
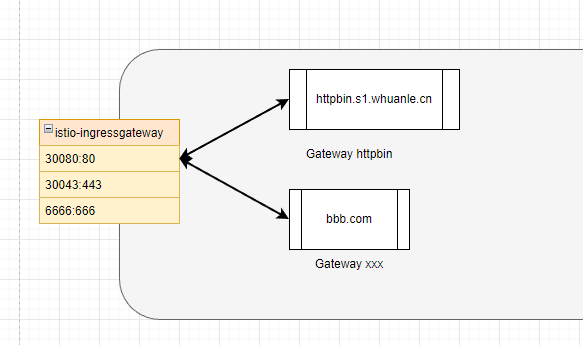
istio-ingressgateway
The ingress gateway refers to the traffic flowing into the cluster from external sources through istio-ingressgateway, and you need to create a Gateway to bind traffic.
You should be familiar with istio-ingressgateway through previous chapters.
The istio-ingressgateway consists of Pods and Services. The istio-ingressgateway itself is a gateway application; you can think of it as Nginx, Apisix, or Kong. You can find similar concepts in various gateway applications.
As an application, it needs to expose certain ports. The istio-ingressgateway only acts when traffic flows through these ports. To expose the ports in Kubernetes, the istio-ingressgateway has a Service object.
With the istio-ingressgateway, we can monitor specific domain names or IPs through an Istio Gateway and expose internal services of the cluster.
The concept of Gateway is very similar to that of Nginx.
For example, looking at the configuration, if Gateway and Nginx want to monitor some inbound traffic, their configurations are as follows:
Nginx:
server {
    listen      80;
    server_name example.org www.example.org;
    #...
}
Gateway:
  servers:
  - port:
      number: 80
      name: http
      protocol: HTTP
    hosts:
    - example.org
    - www.example.org
These configurations specify which traffic to monitor for both Gateway and Nginx.
Next, after monitoring the specified inbound traffic, the traffic needs to be forwarded to an application within the cluster.
Nginx can directly set this in the same configuration file:
server {
    listen      80;
    server_name example.org www.example.org;
    #...
}

location /some/path/ {
    proxy_pass http://bookinfo:9080/;
}
While Gateway requires the use of VirtualService to specify where to forward the traffic and VirtualService can further filter inbound addresses.
spec:
  hosts:
  - "www.example.org"
  gateways:
  # Bind Gateway
  - mygateway
  http:
    route:
    - destination:
        host: bookinfo
        port:
          number: 9080
So in summary, Istio's approach is for the Gateway to monitor inbound traffic, using VirtualService to set traffic entering strategy, and pointing to the Service. DestinationRule then defines the strategy of traffic flowing to the Pods.
Deploying the Service
Next, we will use the httpbin service as an example of how to configure external access to the httpbin service step by step.
First, let's deploy an httpbin service. This httpbin service is simple and contains a Service and Deployment.
httpbin.yaml
apiVersion: v1
kind: ServiceAccount
metadata:
  name: httpbin
---
apiVersion: v1
kind: Service
metadata:
  name: httpbin
  labels:
    app: httpbin
    service: httpbin
spec:
  ports:
  - name: http
    port: 8000
    targetPort: 80
  selector:
    app: httpbin
---
apiVersion: apps/v1
kind: Deployment
metadata:
  name: httpbin
spec:
  replicas: 1
  selector:
    matchLabels:
      app: httpbin
      version: v1
  template:
    metadata:
      labels:
        app: httpbin
        version: v1
    spec:
      serviceAccountName: httpbin
      containers:
      - image: docker.io/kennethreitz/httpbin
        imagePullPolicy: IfNotPresent
        name: httpbin
        ports:
        - containerPort: 80
kubectl -n bookinfo apply -f httpbin.yaml
Configuring Gateway
Then create a Gateway, specifying which inbound traffic to listen to.
httpbin_gw.yaml
apiVersion: networking.istio.io/v1alpha3
kind: Gateway
metadata:
  name: httpbin-gateway
spec:
  selector:
    istio: ingressgateway # use Istio's default gateway implementation
  servers:
  - port:
      number: 80
      name: http
      protocol: HTTP
    hosts:
    - "httpbin.s1.whuanle.cn"
    - "*"
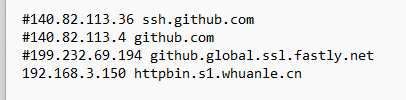
This step is intended to help you intuitively understand the Gateway through the domain name; you can modify
httpbin.s1.whuanle.cnto replace it with your own domain name.Then on your own computer, open
C:\Windows\System32\drivers\etc\hostsand add a record to point the IP to your server.
kubectl -n bookinfo apply -f httpbin_gw.yaml
Now, we have made the istio-ingressgateway keep track of the address httpbin.s1.whuanle.cn. If someone accesses httpbin.s1.whuanle.cn, that traffic will flow into the httpbin-gateway.
Next, we will configure the service address for the Gateway and set the suffixes allowed for external access.
配置 VistualService:
apiVersion: networking.istio.io/v1alpha3
kind: VirtualService
metadata:
  name: httpbin
spec:
  hosts:
  - "*"
  gateways:
  - httpbin-gateway
  http:
  - match:
    - uri:
        prefix: /status
    - uri:
        prefix: /delay
    route:
    - destination:
        port:
          number: 8000
        host: httpbin
When there is only one port for both Gateway and VirtualService, port binding configuration is not required.
kubectl -n bookinfo apply -f httpbin_vs.yaml
找到 istio-ingressgateway 对外暴露的端口。
kubectl get svc istio-ingressgateway -n istio-system

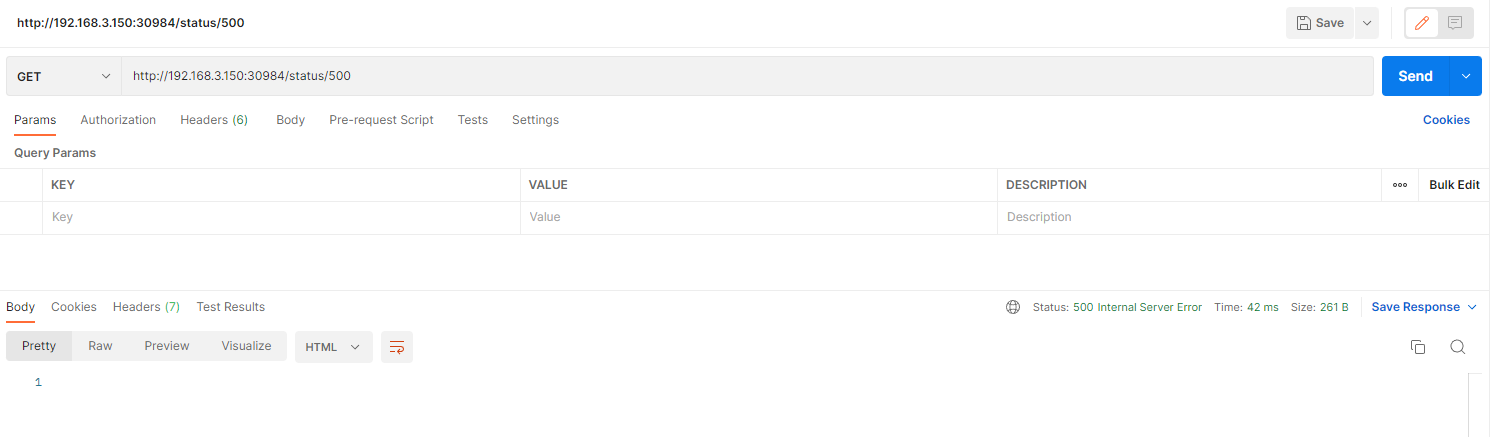
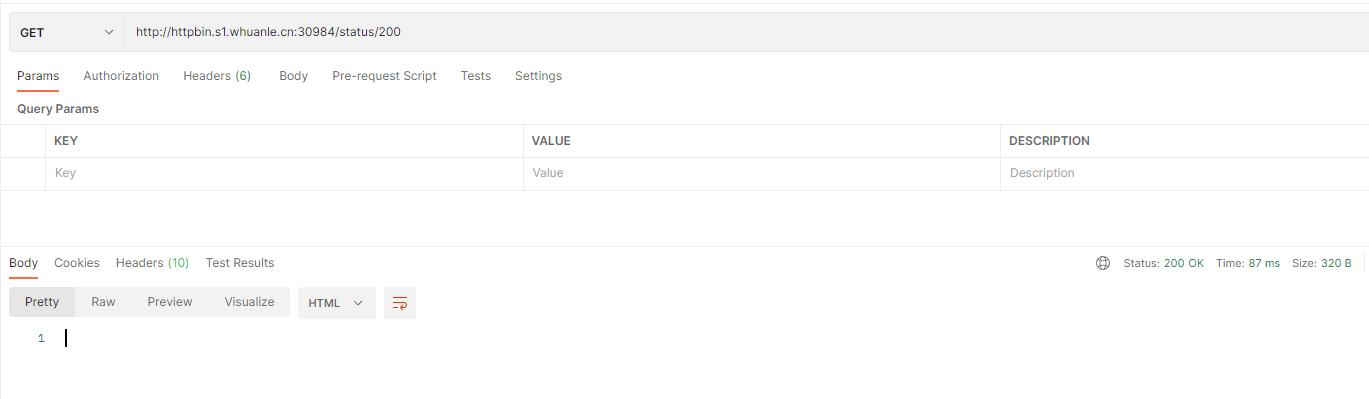
httpbin 是一个 http 测试程序,我们可以通过使用 /status/{状态码} 获取对应的 http 请求状态。
例如:
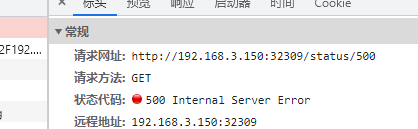
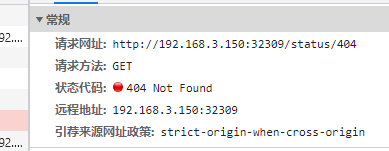
如果我们不希望这个服务被外界访问到,我们可以先把 /status 删除。
kubectl apply -f - <<EOF
apiVersion: networking.istio.io/v1alpha3
kind: VirtualService
metadata:
  name: httpbin
spec:
  hosts:
  - "*"
  gateways:
  - httpbin-gateway
  http:
  - match:
    - uri:
        prefix: /delay
    route:
    - destination:
        port:
          number: 8000
        host: httpbin
EOF
此时你将无法访问 status 路径。但是我们还可以访问 /delay 路径。
httpbin 的 /delay 路径用于测试延迟 http 请求响应使用,/delay/{秒数} 可以指定服务器在多久之后才会返回响应。
例如 http://192.168.3.150:32309/delay/5 将在 5 秒后响应。
httpbin 还有很多路由接口,我们可以通过 VirtualService 配置放通哪些路径。
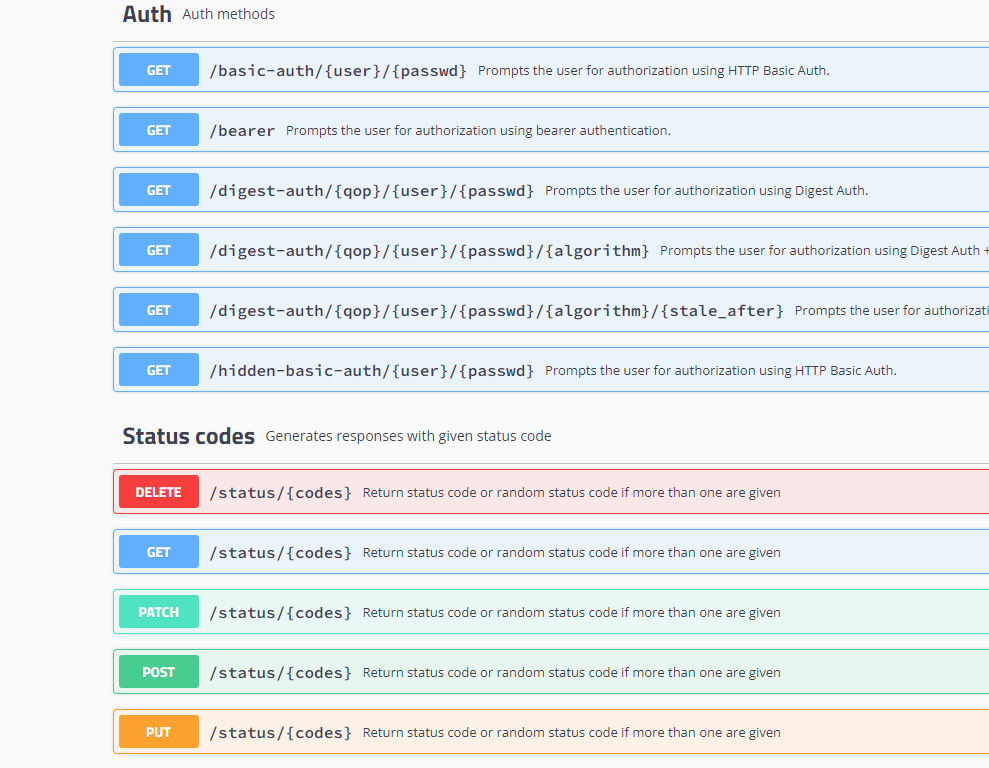
如果需要全部放通,可以使用:
kubectl apply -f - <<EOF
apiVersion: networking.istio.io/v1alpha3
kind: VirtualService
metadata:
  name: httpbin
spec:
  hosts:
  - "*"
  gateways:
  - httpbin-gateway
  http:
  - match:
    - uri:
        prefix: /
    route:
    - destination:
        port:
          number: 8000
        host: httpbin
        subset: v1
EOF
子版本
第四章中进行版本路由实验时使用到,可以将流量导入到不同的版本之中。
kubectl -n bookinfo apply -f - <<EOF
apiVersion: networking.istio.io/v1alpha3
kind: DestinationRule
metadata:
  name: httpbin
spec:
  host: httpbin
  subsets:
  - name: v1
    labels:
      version: v1
EOF
首先是使用 DestinationRule 指向一个 Service:
host: httpbin
当然,我们也可以写成
host: httpbin.bookinfo.svc.cluster.local
通过 host 可以识别到对应的 Kubernetes Service,然后从 Service 对应的 Endpoints 中获得所有 Pod 列表。
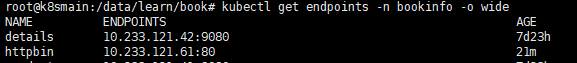
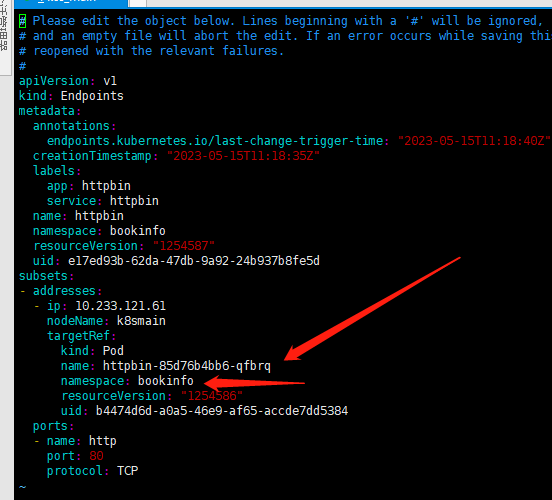
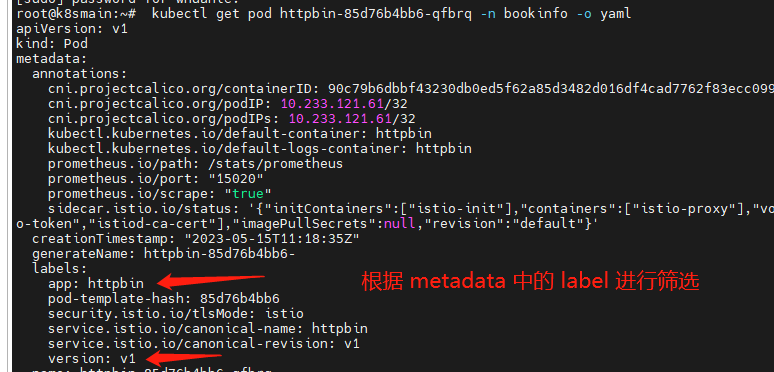
通过 Endpoints 获得所有 Pod 之后,查看每个 Pod 的描述信息。当有一个请求到达时,根据 DestinationRule 中的标签选择器,选择合适的 Pod 进行访问。
  - name: v1
    labels:
      version: v1
istio-egressgateway
istio-egressgateway 也是 Istio 中的一种组件,需要自行安装。安装 istio-egressgateway 命令:
helm install istio-egressgateway istio/gateway -n istio-system
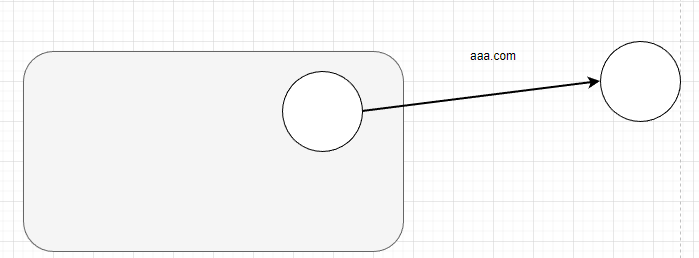
在集群中,如果 A 应用访问的地址属于集群中的应用,那么 Istio 可以给这些请求注入各种行为,实现负载均衡和熔断等。
可是,如果集群内部要访问外部的一个服务时,需要配置访问地址,如 aaa.com,我们应该如何实现负载均衡和熔断这些功能呢?
Istio ServiceEntry 是一种资源,允许将外部服务(即不在 Istio 服务网格中的服务)纳入Istio服务网格。通过将外部服务添加到网格,可以使用 Istio 的流量管理和策略功能来控制与这些外部服务的交互。
以下是一个ServiceEntry示例,将外部HTTP服务 www.google.com添加到Istio服务网格:
apiVersion: networking.istio.io/v1alpha3
kind: ServiceEntry
metadata:
  name: google
spec:
  hosts:
  - www.google.com
  addresses:
  - 192.168.1.1
  ports:
  - number: 80
    name: http
    protocol: HTTP
  location: MESH_EXTERNAL
  resolution: DNS
  endpoints:
  - address: "www.google.com"
    ports:
      http: 80
    locality: "us-west1/zone1"
  exportTo:
  - "*"
在此示例中,我们创建了一个名为httpbin-ext的ServiceEntry资源。指定的主机为httpbin.org,端口号为80,协议为HTTP。此外,我们将resolution设置为DNS,将location设置为MESH_EXTERNAL,表示该服务位于网格之外。
要将此ServiceEntry应用到集群,请将其保存到一个YAML文件(例如:httpbin-ext.yaml),然后运行以下命令:
kubectl apply -f httpbin-ext.yaml
现在,Istio 服务网格中的服务访问 www.google.com 时仍受Istio策略的控制。例如,可以为此 ServiceEntry 创建 VirtualService 以应用流量管理规则,或者为其创建 DestinationRule 以配置负载均衡和连接池设置。
spec: 包含ServiceEntry的具体配置的对象。
hosts: 一个包含要导入的外部服务的主机名(FQDN)的列表。例如:["httpbin.org"]。addresses: (可选)与外部服务关联的虚拟IP地址的列表。例如:["192.168.1.1"]。- ports: 一个描述外部服务使用的端口的列表。每个端口都有以下属性:
number: 端口号,例如:80。name: 端口的名称,例如:http。protocol: 使用的协议,例如:HTTP、TCP、HTTPS等。
location: 服务的位置。可以是MESH_EXTERNAL(表示服务在网格外部)或MESH_INTERNAL(表示服务在网格内部,但不属于任何已知服务)。resolution: 用于确定服务实例地址的解析方法。可以是NONE(默认值,表示不解析地址),STATIC(表示使用addresses字段中的IP地址),DNS(表示使用DNS解析主机名)或MESH_EXTERNAL。- endpoints: (可选)外部服务的端点列表。每个端点都有以下属性:
address: 端点的IP地址或主机名。ports: 一个包含端口名称和端口号的映射,例如:{"http": 8080}。labels: (可选)应用于端点的标签。locality: (可选)端点的地理位置,例如:us-west1/zone1。
exportTo: (可选)一个包含命名空间名称的列表,指定可以访问此ServiceEntry的命名空间。可以使用星号(*)表示所有命名空间。默认值为*。subjectAltNames: (可选)用于验证服务器证书主题替代名(SANs)的列表。
读者可以从官方文档中了解更多:
https://istio.io/latest/zh/docs/tasks/traffic-management/egress/egress-control/
6,金丝雀发布
项目总是处于不断变化之中,每次发布新的版本时,都考验了团队的运维能力。

新版本上线之前,经历过开发和测试人员的验证,也经过产品经理的验收。可是当要上线到生产环境时,谁也保证不了上线一定就能跑起来。所以往往需要在上线时保持新版本和旧版本同时在用,测试人员或内测用户可以访问新版本,其他人继续使用旧版本。再有就是上线时新旧系统能够丝滑切换,用户完全感知不到这种变化。
并且新版本上线时,不应该影响旧版本的运行,要求实现不停止更新。但是除了应用本身,还涉及到新旧版本共有同一个数据库,新旧版本应用对应的数据库表结构不一样。
新旧版本切换带来的问题很多,但是,在本系列教程中我们只考虑外部访问效果即可。
很多项目的版本更新做得并不好。很多初级阶段的 Web 服务团队,每次更新都需要中断当前的应用,后端服务有一段时间内不可用。如果新版本有问题,那么还需要重新发布旧版本。如果只是内部服务,问题不大,可是如果系统是给客户使用的,那么很容易让客户给出一个低分的评价。

Kubernetes 中虽然有滚动升级,能够逐渐使用新版本的 Pod 替换旧版本的 Pod,两个版本共存,但是并不能做到流量自由切分,一个流量进入时,依然会在新旧版本的 Pod 中轮询选择。但是我们还是可以调整 v1 和 v2 的 Pod 数量,实现流量按照比例划分,比如 v1 的 Pod 数量有 40 个,v2 的 Pod 的数量有 60 个,那么按照比例,会有 60% 的流量进入到 v2 中。不过这样并没有什么鸟用。
Kubernetes 滚动升级、伸缩参考资料:https://k8s.whuanle.cn/3.pod/6.scale.html
Istio 中虽然没有名为金丝雀发布的功能,但是按照之前我们所学到的 Istio 的 VirtualService、DestinationRule 就可以实现根据请求的 header 等,将流量转发到不同的子版本中,我们使用这些操作方法即可实现金丝雀发布。
金丝雀发布
尴尬,在学习 Istio 之前,我对蓝绿发布、灰度发布、金丝雀发布的概念并不清晰,很多文章都是将它们分成三类发布方式。实际上蓝绿发布和金丝雀发布都是灰度发布的一种。
灰度发布是两个版本共存,将一小部分流量切到新版本中,当新版本经过一段时间验证后,如果没有问题,再将流量逐步切换到新版本中。
所以,可以把蓝绿发布、A/B 测试、金丝雀发布都划分为灰度发布。
当然,它们有一些差别,每个人的划分方法也有差别,有的说法是金丝雀发布才是灰度发布。
蓝绿发布
蓝绿发布的方式是使用另一套资源部署新版本,然后将旧版本的流量都切换到新版本中去,缺点是需要消耗两套资源,而且蓝绿发布是全量切换,如果新版本出现问题则会影响到所有用户。
A/B 测试
A/B 测试是同时部署两个版本对等的版本来接收流量,但它不是指新旧版本。比如,产品经理有一个好主意,做新时代的农场区块链,想知道大家喜欢养猪还是养鸡。于是发布了养猪农场和养鸡农场两个对等的应用,然后邀请不同的用户进行内测,喜欢养猪的用户会被导向养猪农场应用。然后收集用户的意见和各种指标数据,分析用户喜欢养什么动物,最后决定上线什么版本。

金丝雀发布
先上线一个新版本,然后根据规则将一小部分用户导向到新应用,观察新版本在生产环境的表现,如果达到预期,则逐步将流量切换到新版本中。
按照流量比例划分
在第四章中,我们使用 DestinationRule 为 reviews 定义了三个版本,但是每个版本只有一个 Pod。
apiVersion: networking.istio.io/v1alpha3
kind: DestinationRule
metadata:
  name: reviews
spec:
  host: reviews
  subsets:
  - name: v1
    labels:
      version: v1
  - name: v2
    labels:
      version: v2
  - name: v3
    labels:
      version: v3
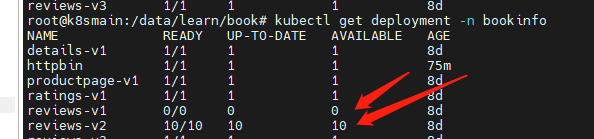
现在使用命令将 v1 版本增加到 10 个 pod。
kubectl scale deployment reviews-v1 -n bookinfo --replicas=10
在原配置不变的情况下,我们来部署 VirtualService,将流量的 90% 打入到包含 10个 Pod 的 v1 版本。因为 v2 版本只有10% 的流量,所以只需要 1 个 Pod 也可以支撑了叭。
kubectl -n bookinfo apply -f - <<EOF
apiVersion: networking.istio.io/v1alpha3
kind: VirtualService
metadata:
  name: reviews
spec:
  hosts:
    - reviews
  http:
  - route:
    - destination:
        host: reviews
        subset: v1
      weight: 90
    - destination:
        host: reviews
        subset: v2
      weight: 10
EOF
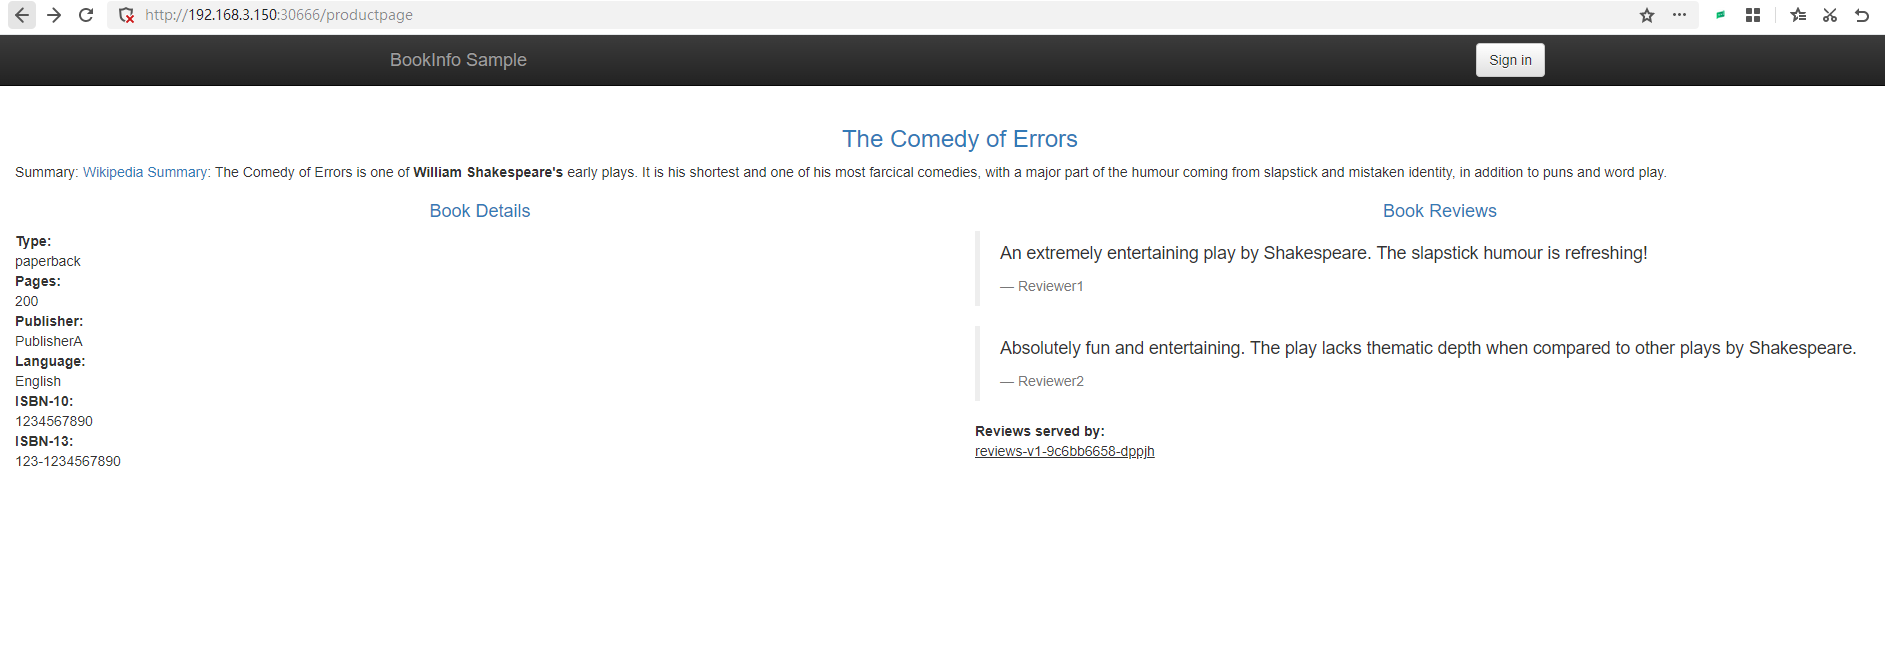
命令之前完毕之后,不断刷新 productpage页面,会发现大部分情况下不会显示评星,少部分情况会出现黑色的星星。
按照 Header 划分
当然,也可以使用 header 的方式,将流量导入到不同的版本中。比如只有测试人员的流量才会打入到新版本中。
  http:
  - match:
    - headers:
        end-user:
          exact: jason
    route:
    - destination:
        host: reviews
        subset: v2
  - route:
    - destination:
        host: reviews
        subset: v1
当我们检查 v2 版本没有问题之后,我们就将 v2 版本扩容。
kubectl scale deployment reviews-v2 -n bookinfo --replicas=10
与此同时,修改 VirtualService,将全部流量路由到 v2 中
kubectl -n bookinfo apply -f - <<EOF
apiVersion: networking.istio.io/v1alpha3
kind: VirtualService
metadata:
  name: reviews
spec:
  hosts:
    - reviews
  http:
  - route:
    - destination:
        host: reviews
        subset: v1
      weight: 0
    - destination:
        host: reviews
        subset: v2
      weight: 100
EOF
After some time, if everything goes well, reduce the number of Pods for version v1 to 0.
kubectl scale deployment reviews-v1 -n bookinfo --replicas=0
However, do not delete version v1. If the new version encounters issues, we can simply adjust the number of Pods for version v1, and then modify the VirtualService to route traffic back to v1.
Canary releases are actually quite simple, and can be easily implemented not just with Istio, but also with gateways like Nginx, Apisix, Kong, etc.

文章评论